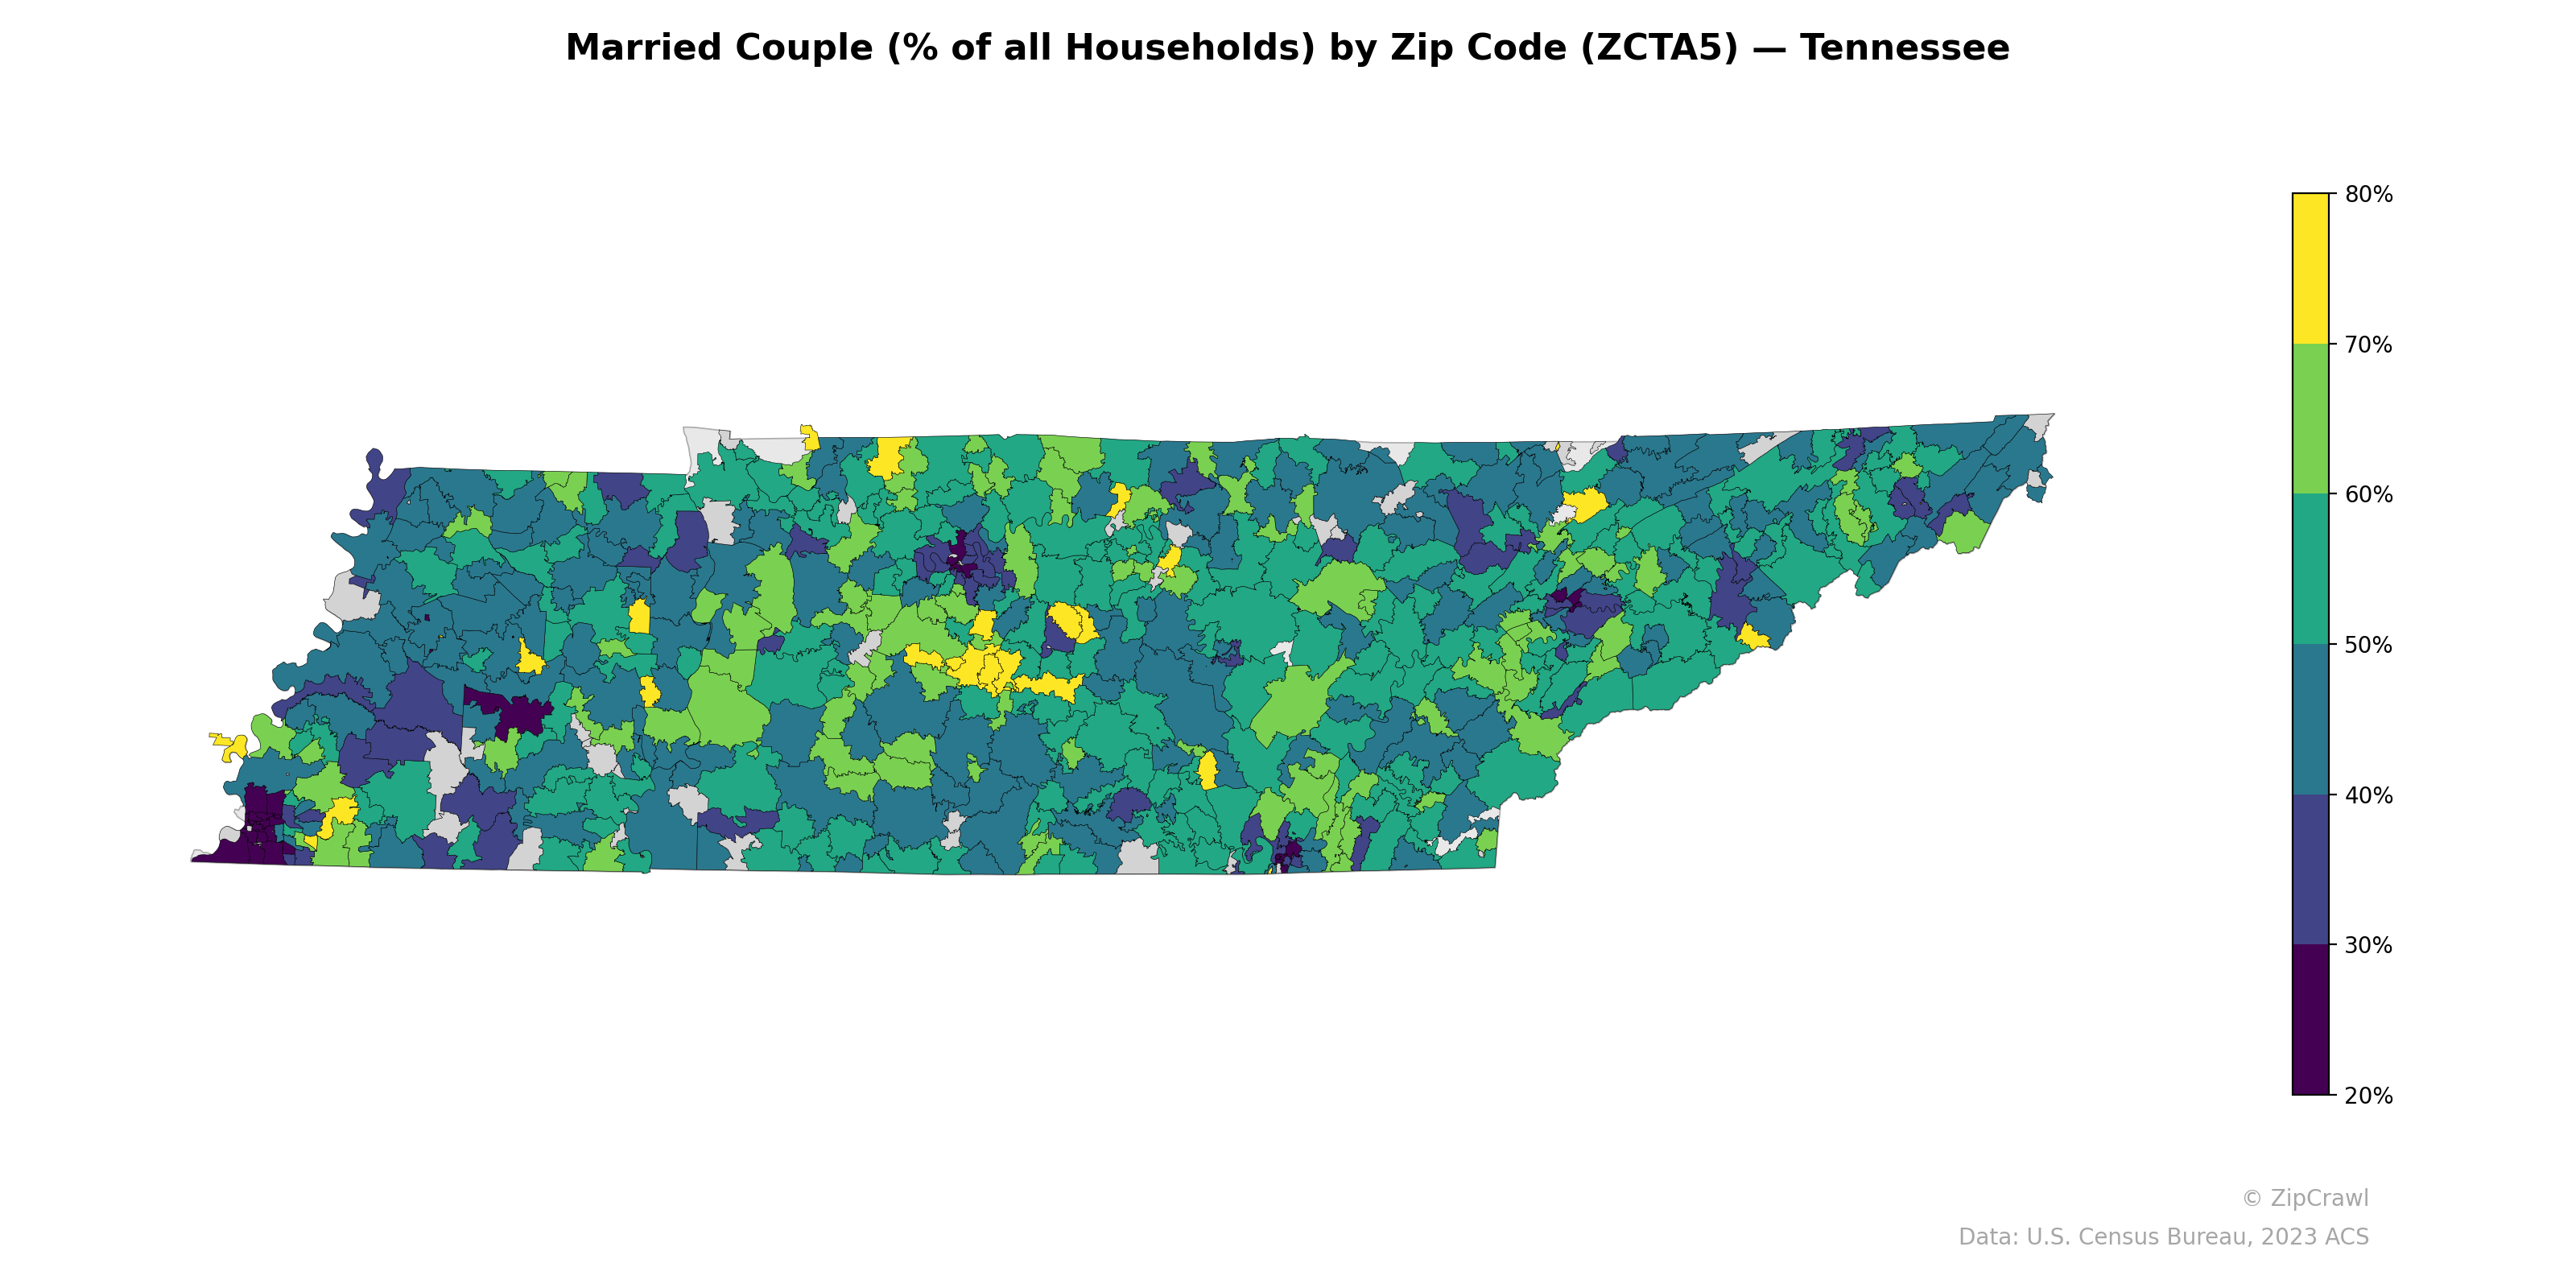
NOTE: Gray indicates insufficient data or a suppressed estimate.
Zip codes in the suburban rings surrounding Nashville and Memphis display notably higher married-couple household percentages, often reaching 70–80%, while urban core areas of both cities drop sharply to 20–30%, creating stark metropolitan contrasts. Rural areas across Middle and East Tennessee generally cluster in the 50–60% range, with pockets of higher rates in exurban communities south of Nashville and in parts of the Upper Cumberland region. West Tennessee outside the Memphis metro tends toward moderate levels (40–55%), with several isolated zip codes showing markedly low percentages likely corresponding to small college towns or concentrated public housing areas.
Data: U.S. Census Bureau, 2023 ACS
Explore
- % of Households with Broadband Internet, by Zip Code (ZCTA5) — Los Angeles Metro
- Housing Owner-Occupied % of Units, by Zip Code (ZCTA5) — Tennessee
- Housing Median Monthly Rent ($), by Zip Code (ZCTA5) — Tennessee
- Housing % of Units Built Since 2010, by Zip Code (ZCTA5) — Tennessee
- % of Households with Broadband Internet, by Zip Code (ZCTA5) — Tennessee
- Housing Owner-Occupied Median Value ($), by Zip Code (ZCTA5) — Tennessee
- % of Population without Health Insurance, by Zip Code (ZCTA5) — Tennessee
- Household Average Size by Zip Code (ZCTA5) — Tennessee
- Bachelor's Degree or Higher (% of Over 25) by Zip Code (ZCTA5) — Tennessee
- Housing Vacancy Rate by Zip Code (ZCTA5) — Tennessee
- Population Hispanic % by Zip Code (ZCTA5) — Delaware
- Population Non-Hispanic Black % by County
- Housing Vacancy Rate by Zip Code (ZCTA5) — Los Angeles Metro
- Household Average Size by Zip Code (ZCTA5) — Los Angeles Metro
- Housing Median Monthly Rent ($), by Zip Code (ZCTA5) — Los Angeles Metro
- Housing % of Units Built Since 2010, by Zip Code (ZCTA5) — Los Angeles Metro
- % of Population without Health Insurance, by Zip Code (ZCTA5) — Los Angeles Metro
- Housing Owner-Occupied % of Units, by Zip Code (ZCTA5) — Los Angeles Metro
- Housing % of Units Built Since 2010, by County
- Bachelor's Degree or Higher (% of Over 25) by Zip Code (ZCTA5) — Los Angeles Metro
- Housing Owner-Occupied Median Value ($), by Zip Code (ZCTA5) — Los Angeles Metro
- High School Graduate (% of Over 25) by Zip Code (ZCTA5) — Tennessee
- Population Non-Hispanic American Indian % by Zip Code (ZCTA5) — Tennessee
- Population Non-Hispanic White % by Zip Code (ZCTA5) — Tennessee
- Median Age by Zip Code (ZCTA5) — Tennessee
- Population Hispanic % by Zip Code (ZCTA5) — Tennessee
- U.S. Citizens (% of Population Over 18) by Zip Code (ZCTA5) — Tennessee
- % of Population on Food Stamps or SNAP (Last 12 Months), by Zip Code (ZCTA5) — Arizona
- Household Median Income by Zip Code (ZCTA5) — Tennessee
- Population Non-Hispanic Black % by Zip Code (ZCTA5) — Tennessee
- Married Couple (% of all Households) by Zip Code (ZCTA5) — Texas
- Married Couple (% of all Households) by Zip Code (ZCTA5) — Ohio
- Married Couple (% of all Households) by Zip Code (ZCTA5) — Maine
- Married Couple (% of all Households) by Zip Code (ZCTA5) — Minnesota
- Married Couple (% of all Households) by Zip Code (ZCTA5) — Utah
- Married Couple (% of all Households) by Zip Code (ZCTA5) — Iowa
- Married Couple (% of all Households) by Zip Code (ZCTA5) — Alaska
- Married Couple (% of all Households) by Zip Code (ZCTA5) — Alabama
- Married Couple (% of all Households) by Zip Code (ZCTA5) — Maryland
- Married Couple (% of all Households) by Zip Code (ZCTA5) — Oregon