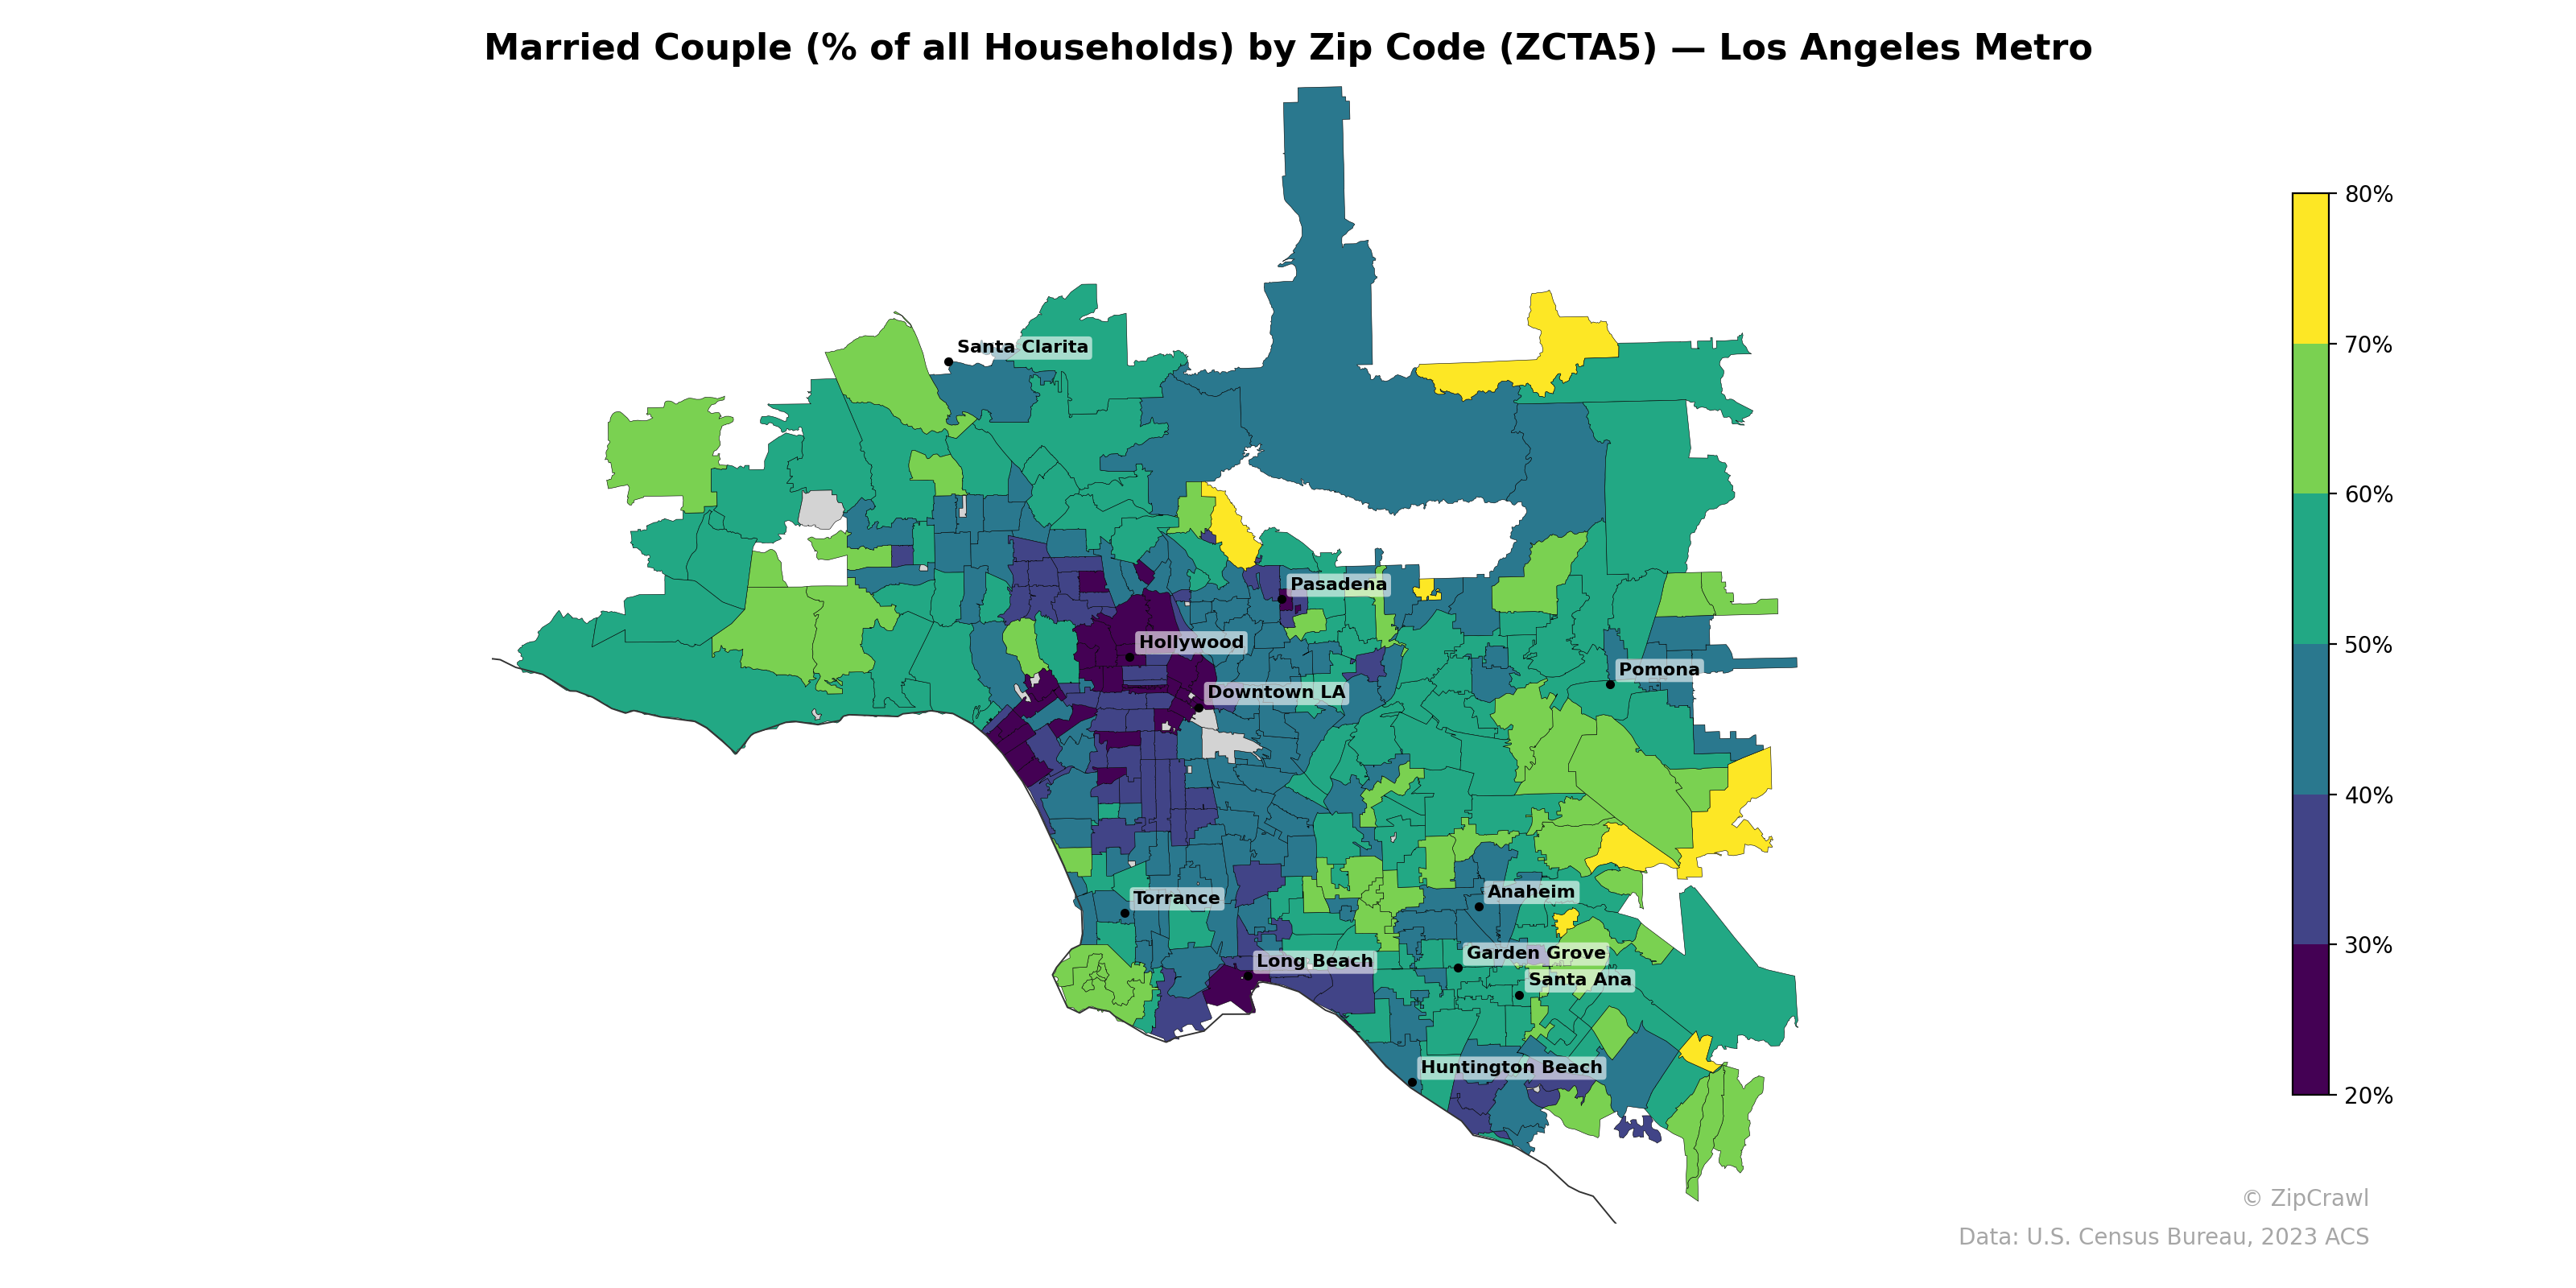
NOTE: Gray indicates insufficient data or a suppressed estimate.
Married-couple households concentrate most heavily in the suburban periphery—particularly the Santa Clarita Valley, the San Gabriel Valley foothills, and south Orange County—where many zip codes exceed 60–70% of all households. In sharp contrast, the urban core running from Hollywood through Downtown LA and into central Long Beach registers the lowest shares, often below 30%, reflecting denser rental markets and younger, more transient populations. A notable east-west gradient emerges in Orange County, with inland zip codes around Irvine and eastern Anaheim Hills skewing substantially higher than coastal and central areas near Santa Ana and Garden Grove.
Data: U.S. Census Bureau, 2023 ACS
Explore
- Population Non-Hispanic Black % by Zip Code (ZCTA5) — Maryland
- U.S. Citizens (% of Population Over 18) by Zip Code (ZCTA5) — Maryland
- Median Age by Zip Code (ZCTA5) — Maryland
- High School Graduate (% of Over 25) by Zip Code (ZCTA5) — Maryland
- Population Non-Hispanic American Indian % by Zip Code (ZCTA5) — Maryland
- % of Population on Food Stamps or SNAP (Last 12 Months), by Zip Code (ZCTA5) — Missouri
- Household Median Income by Zip Code (ZCTA5) — Maryland
- Population Non-Hispanic Asian % by Zip Code (ZCTA5) — Missouri
- Population Hispanic % by Zip Code (ZCTA5) — Maryland
- Population Non-Hispanic White % by Zip Code (ZCTA5) — Maryland
- Population Non-Hispanic Black % by County
- Housing Vacancy Rate by Zip Code (ZCTA5) — Los Angeles Metro
- Household Average Size by Zip Code (ZCTA5) — Los Angeles Metro
- Housing Median Monthly Rent ($), by Zip Code (ZCTA5) — Los Angeles Metro
- % of Households with Broadband Internet, by Zip Code (ZCTA5) — Los Angeles Metro
- Bachelor's Degree or Higher (% of Over 25) by Zip Code (ZCTA5) — Los Angeles Metro
- Housing Owner-Occupied % of Units, by Zip Code (ZCTA5) — Los Angeles Metro
- Housing Owner-Occupied Median Value ($), by Zip Code (ZCTA5) — Los Angeles Metro
- % of Population without Health Insurance, by Zip Code (ZCTA5) — Los Angeles Metro
- Housing % of Units Built Since 2010, by Zip Code (ZCTA5) — Los Angeles Metro
- Housing Median Monthly Rent ($), by Zip Code (ZCTA5) — Tennessee
- Housing Owner-Occupied % of Units, by Zip Code (ZCTA5) — Tennessee
- Housing % of Units Built Since 2010, by Zip Code (ZCTA5) — Tennessee
- Population Non-Hispanic American Indian % by Zip Code (ZCTA5) — Tennessee
- Population Non-Hispanic Black % by Zip Code (ZCTA5) — Tennessee
- High School Graduate (% of Over 25) by Zip Code (ZCTA5) — Tennessee
- % of Households with Broadband Internet, by Zip Code (ZCTA5) — Tennessee
- % of Population without Health Insurance, by Zip Code (ZCTA5) — Tennessee
- Housing Owner-Occupied Median Value ($), by Zip Code (ZCTA5) — Tennessee
- Population Non-Hispanic White % by Zip Code (ZCTA5) — Tennessee
- Married Couple (% of all Households) by Zip Code (ZCTA5) — Houston Metro
- Married Couple (% of all Households) by Zip Code (ZCTA5) — St. Louis Metro
- Married Couple (% of all Households) by Zip Code (ZCTA5) — Miami Metro
- Married Couple (% of all Households) by Zip Code (ZCTA5) — Boston Metro
- Married Couple (% of all Households) by Zip Code (ZCTA5) — Detroit Metro
- Married Couple (% of all Households) by Zip Code (ZCTA5) — Austin Metro
- Married Couple (% of all Households) by Zip Code (ZCTA5) — Tampa Metro
- Married Couple (% of all Households) by Zip Code (ZCTA5) — Dallas Metro
- Married Couple (% of all Households) by Zip Code (ZCTA5) — Atlanta Metro
- Married Couple (% of all Households) by Zip Code (ZCTA5) — Seattle Metro