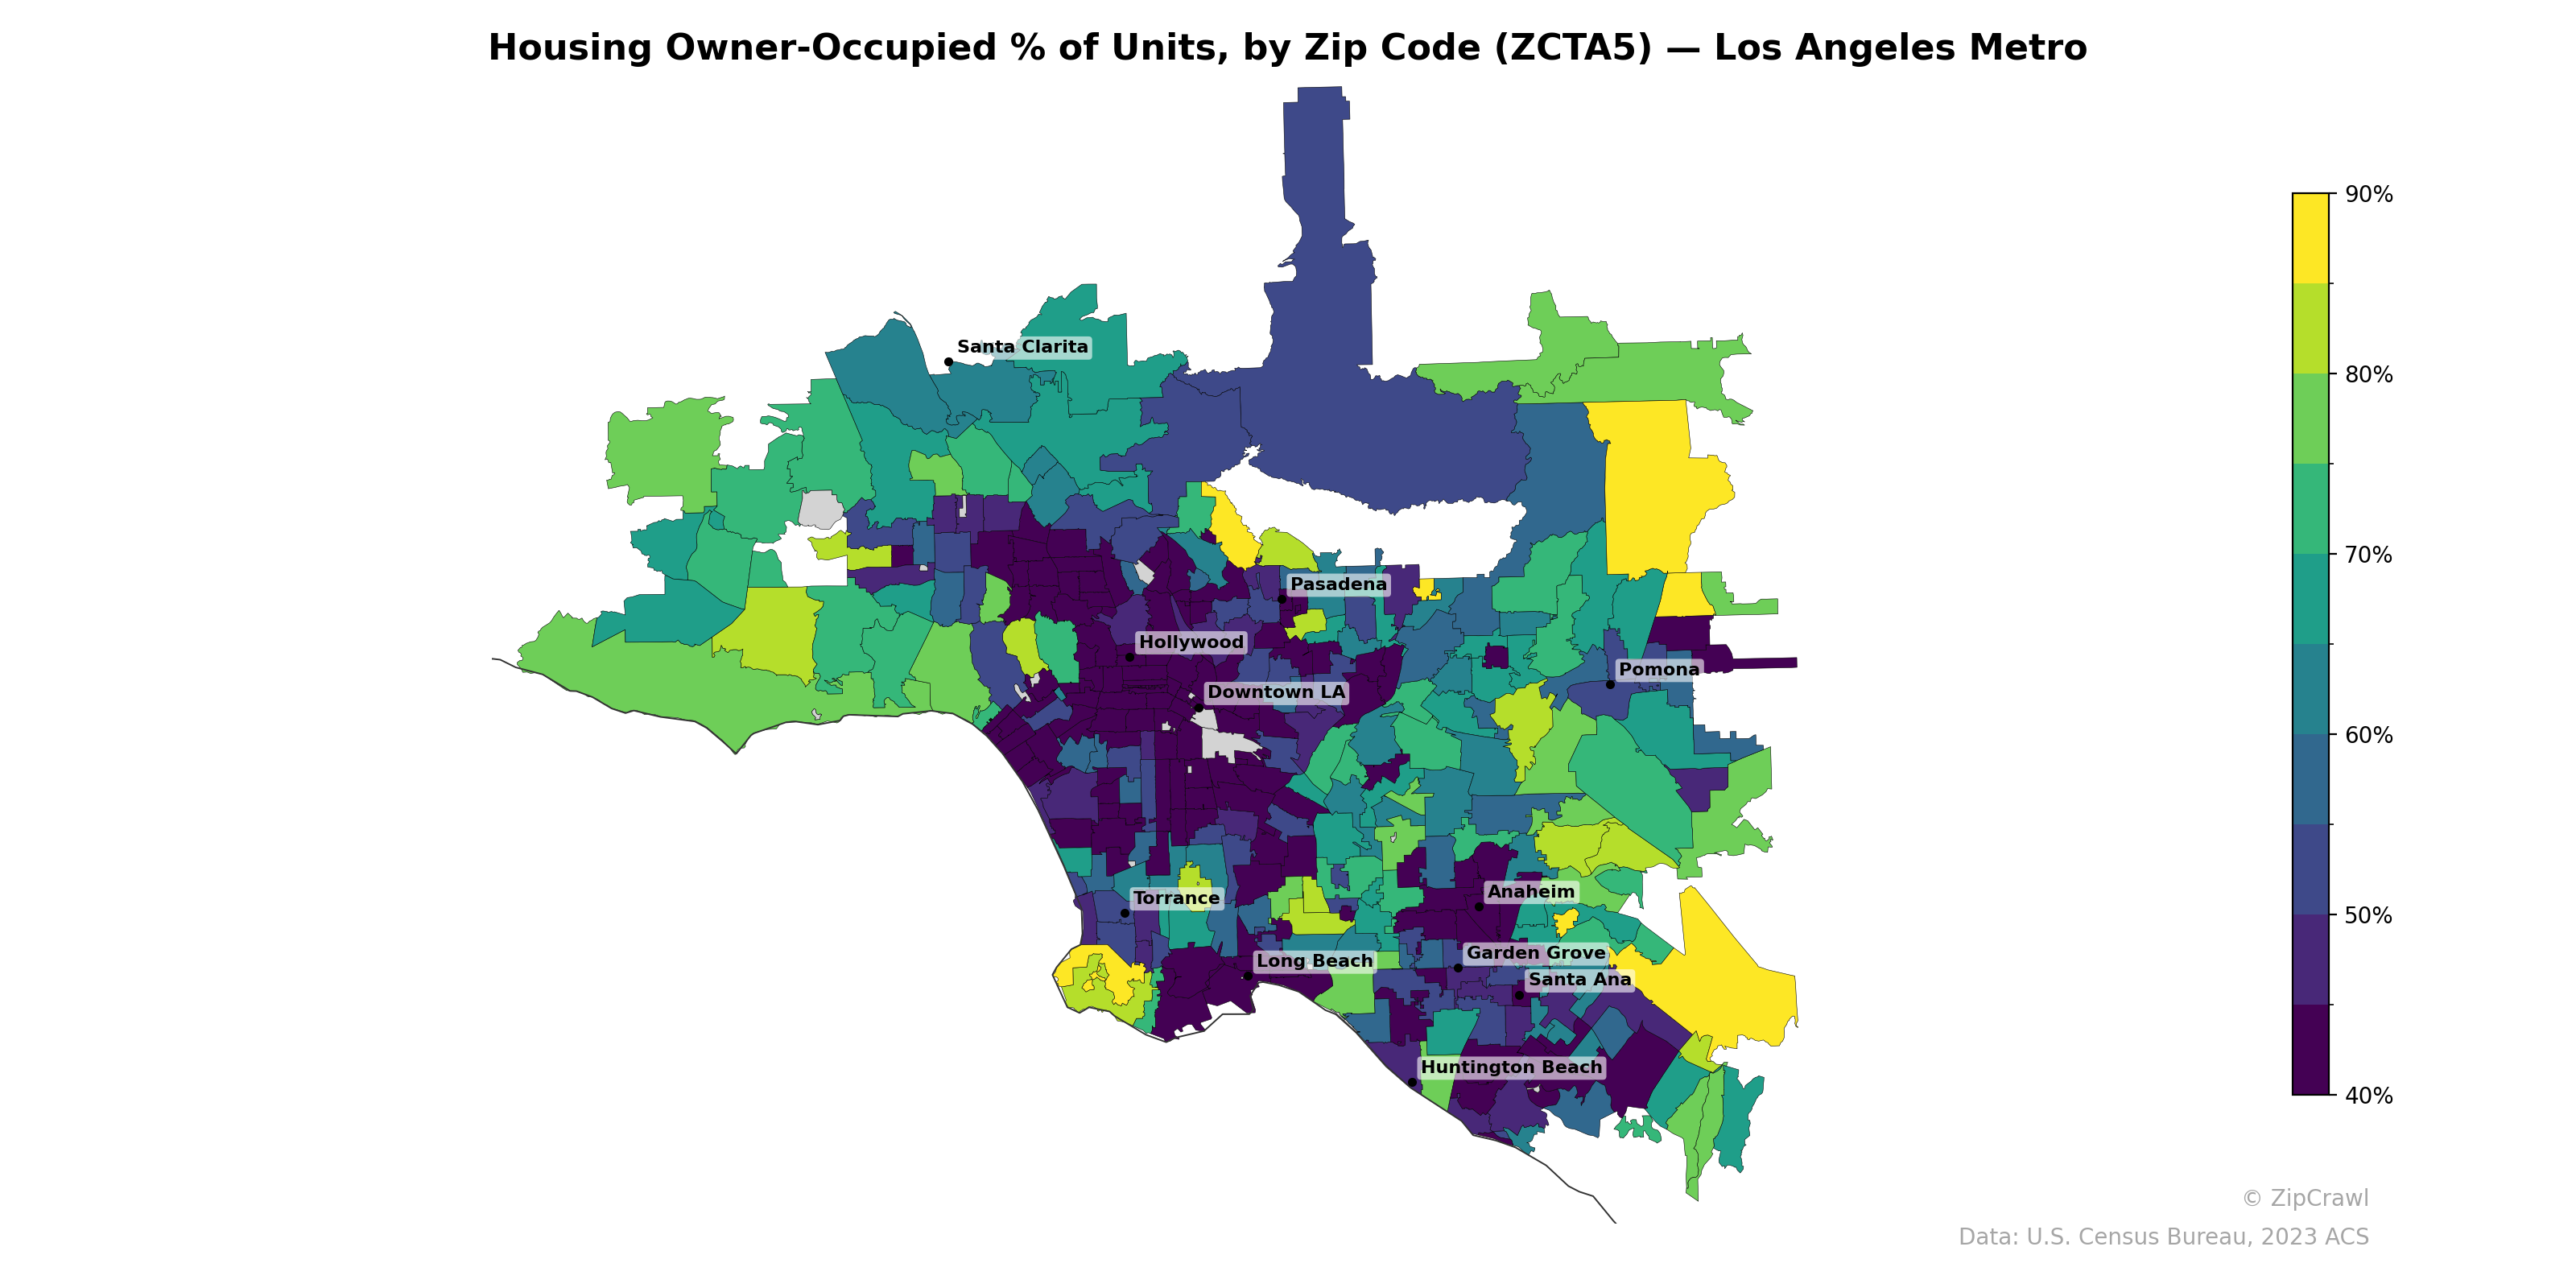
NOTE: Gray indicates insufficient data or a suppressed estimate.
Owner-occupancy rates in the Los Angeles metro area exhibit a stark urban-suburban divide, with the lowest concentrations (below 40–50%) clustering tightly around Downtown LA, Hollywood, and much of central and south Los Angeles, reflecting the dense rental-dominated housing stock of the urban core. Suburban and exurban areas to the north—particularly around Santa Clarita and the foothill communities northeast of Pasadena—along with pockets in eastern Orange County and the far eastern San Gabriel Valley, consistently reach 70–90% owner-occupancy. Notably, Orange County displays significant internal variation, with Santa Ana registering among the lowest owner-occupancy rates in the metro while adjacent communities like Huntington Beach and areas south of Anaheim trend considerably higher.
Data: U.S. Census Bureau, 2023 ACS
Explore
- % of Population without Health Insurance, by Zip Code (ZCTA5) — Massachusetts
- Housing Owner-Occupied Median Value ($), by Zip Code (ZCTA5) — Massachusetts
- Married Couple (% of all Households) by Zip Code (ZCTA5) — Massachusetts
- Housing Vacancy Rate by Zip Code (ZCTA5) — Massachusetts
- Household Average Size by Zip Code (ZCTA5) — Massachusetts
- Bachelor's Degree or Higher (% of Over 25) by Zip Code (ZCTA5) — Massachusetts
- % of Households with Broadband Internet, by Zip Code (ZCTA5) — Massachusetts
- Housing Median Monthly Rent ($), by Zip Code (ZCTA5) — Massachusetts
- Housing % of Units Built Since 2010, by Zip Code (ZCTA5) — Massachusetts
- Population Non-Hispanic Black % by County
- Married Couple (% of all Households) by Zip Code (ZCTA5) — Los Angeles Metro
- Housing Vacancy Rate by Zip Code (ZCTA5) — Los Angeles Metro
- Housing % of Units Built Since 2010, by Zip Code (ZCTA5) — Los Angeles Metro
- % of Households with Broadband Internet, by Zip Code (ZCTA5) — Los Angeles Metro
- Bachelor's Degree or Higher (% of Over 25) by Zip Code (ZCTA5) — Los Angeles Metro
- % of Population without Health Insurance, by Zip Code (ZCTA5) — Los Angeles Metro
- Housing Owner-Occupied Median Value ($), by Zip Code (ZCTA5) — Los Angeles Metro
- Housing Median Monthly Rent ($), by Zip Code (ZCTA5) — Los Angeles Metro
- Household Average Size by Zip Code (ZCTA5) — Los Angeles Metro
- Housing % of Units Built Since 2010, by Zip Code (ZCTA5) — Tennessee
- Housing Owner-Occupied Median Value ($), by Zip Code (ZCTA5) — Tennessee
- Household Average Size by Zip Code (ZCTA5) — Tennessee
- Population Non-Hispanic Black % by Zip Code (ZCTA5) — Tennessee
- High School Graduate (% of Over 25) by Zip Code (ZCTA5) — Tennessee
- Population Non-Hispanic White % by Zip Code (ZCTA5) — Tennessee
- Population Non-Hispanic American Indian % by Zip Code (ZCTA5) — Tennessee
- % of Households with Broadband Internet, by Zip Code (ZCTA5) — Tennessee
- % of Population without Health Insurance, by Zip Code (ZCTA5) — Tennessee
- Housing Median Monthly Rent ($), by Zip Code (ZCTA5) — Tennessee
- Median Age by Zip Code (ZCTA5) — Tennessee
- Housing Owner-Occupied % of Units, by Zip Code (ZCTA5) — Houston Metro
- Housing Owner-Occupied % of Units, by Zip Code (ZCTA5) — St. Louis Metro
- Housing Owner-Occupied % of Units, by Zip Code (ZCTA5) — Austin Metro
- Housing Owner-Occupied % of Units, by Zip Code (ZCTA5) — Miami Metro
- Housing Owner-Occupied % of Units, by Zip Code (ZCTA5) — Atlanta Metro
- Housing Owner-Occupied % of Units, by Zip Code (ZCTA5) — Denver Metro
- Housing Owner-Occupied % of Units, by Zip Code (ZCTA5) — Detroit Metro
- Housing Owner-Occupied % of Units, by Zip Code (ZCTA5) — Boston Metro
- Housing Owner-Occupied % of Units, by Zip Code (ZCTA5) — Tampa Metro
- Housing Owner-Occupied % of Units, by Zip Code (ZCTA5) — Orlando Metro