NOTE: Gray indicates insufficient data or a suppressed estimate.
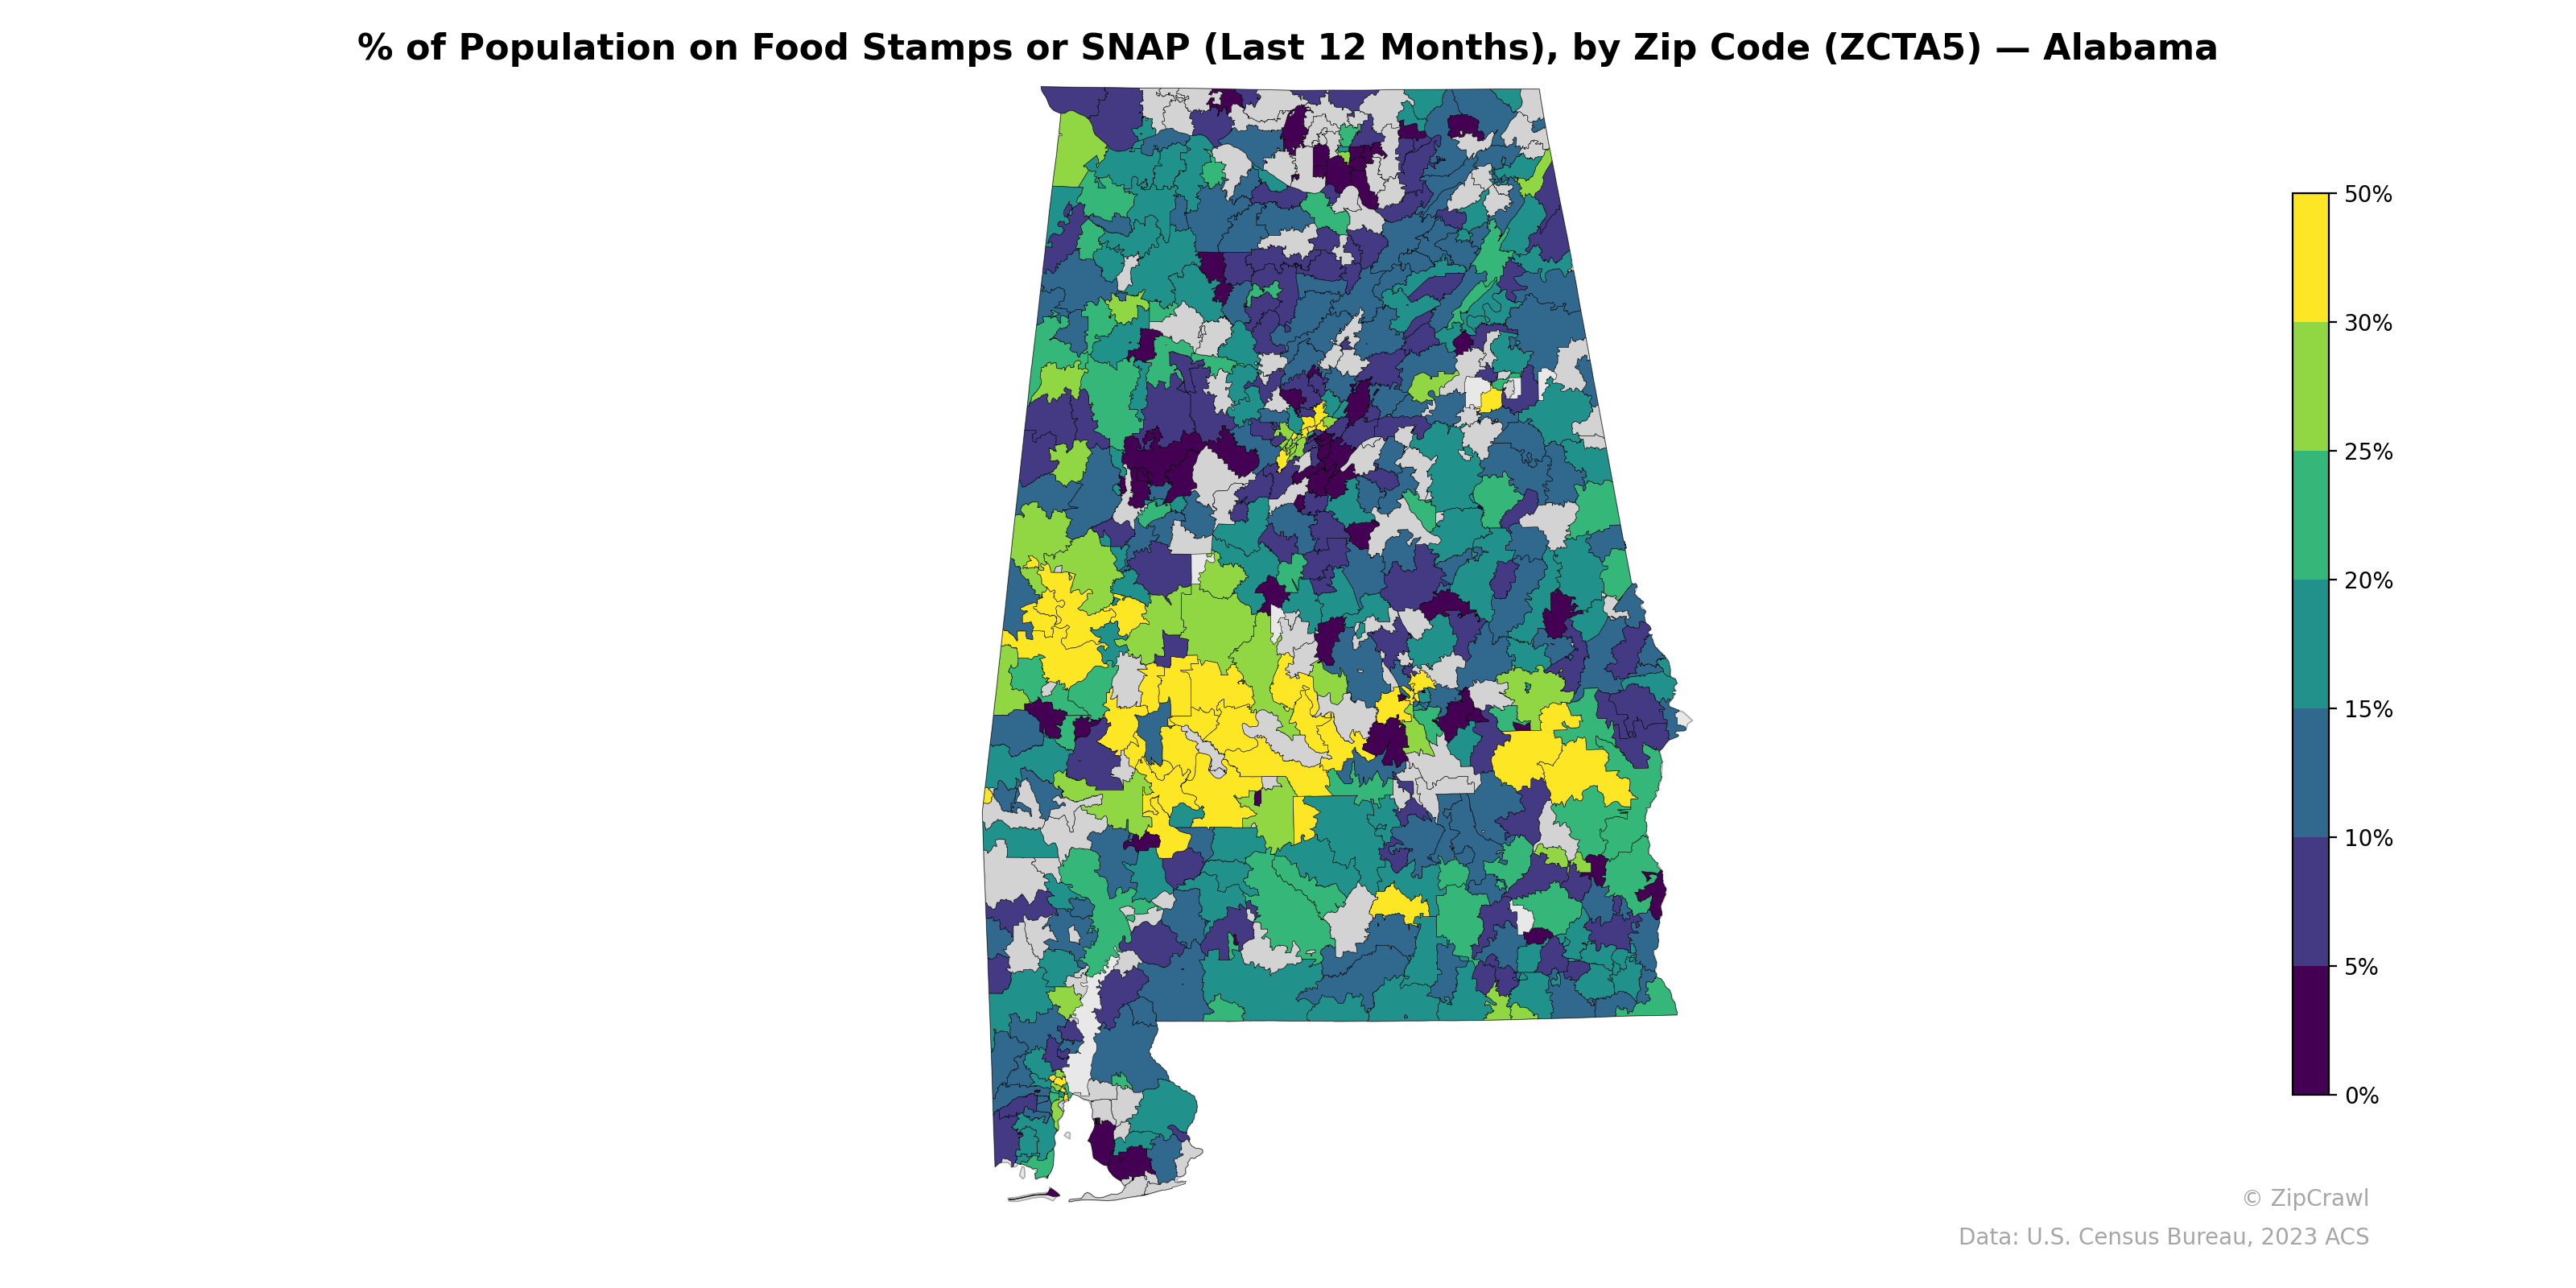
Alabama's Black Belt region—stretching across the south-central part of the state—displays the highest SNAP participation rates, with numerous zip codes exceeding 40-50%, reflecting the persistent poverty concentrated in this historically underserved rural corridor. Northern Alabama presents a more mixed pattern, with lower-usage zip codes (under 15%) interspersed among moderate-usage areas, particularly around the Huntsville and suburban Birmingham corridors. The contrast between the deep yellow clusters in west-central Alabama (Tuscaloosa to Selma corridor) and the darker blue-purple zip codes in the affluent suburban rings around Birmingham and along the Gulf Coast underscores stark intrastate economic disparities.
Data: U.S. Census Bureau, 2023 ACS
Explore
- Married Couple (% of all Households) by Zip Code (ZCTA5) — Alabama
- Median Age by Zip Code (ZCTA5) — Louisiana
- Household Median Income by Zip Code (ZCTA5) — Louisiana
- U.S. Citizens (% of Population Over 18) by Zip Code (ZCTA5) — Louisiana
- Housing Vacancy Rate by Zip Code (ZCTA5) — Alabama
- Population Non-Hispanic Asian % by Zip Code (ZCTA5) — Alabama
- Population Hispanic % by Zip Code (ZCTA5) — Louisiana
- Population Non-Hispanic Black % by Zip Code (ZCTA5) — Louisiana
- Population Non-Hispanic White % by Zip Code (ZCTA5) — Louisiana
- Housing Median Monthly Rent ($), by County
- % of Households with Broadband Internet, by County
- Population Non-Hispanic Black % by Zip Code (ZCTA5) — California
- Population Non-Hispanic American Indian % by Zip Code (ZCTA5) — California
- High School Graduate (% of Over 25) by Zip Code (ZCTA5) — California
- Housing Owner-Occupied % of Units, by Zip Code (ZCTA5) — California
- Median Age by Zip Code (ZCTA5) — California
- Population Non-Hispanic Asian % by Zip Code (ZCTA5) — Texas
- Household Median Income by Zip Code (ZCTA5) — California
- Population Non-Hispanic White % by Zip Code (ZCTA5) — California
- Population Hispanic % by Zip Code (ZCTA5) — California
- U.S. Citizens (% of Population Over 18) by Zip Code (ZCTA5) — California
- Housing Median Monthly Rent ($), by Zip Code (ZCTA5) — Alabama
- Housing Owner-Occupied Median Value ($), by Zip Code (ZCTA5) — Alabama
- Housing % of Units Built Since 2010, by Zip Code (ZCTA5) — Alabama
- % of Households with Broadband Internet, by Zip Code (ZCTA5) — Alabama
- % of Population without Health Insurance, by Zip Code (ZCTA5) — Alabama
- Household Average Size by Zip Code (ZCTA5) — Alabama
- Housing Owner-Occupied % of Units, by Zip Code (ZCTA5) — Alabama
- High School Graduate (% of Over 25) by Zip Code (ZCTA5) — Alabama
- Bachelor's Degree or Higher (% of Over 25) by Zip Code (ZCTA5) — Alabama
- % of Population on Food Stamps or SNAP (Last 12 Months), by Zip Code (ZCTA5) — Alaska
- % of Population on Food Stamps or SNAP (Last 12 Months), by Zip Code (ZCTA5) — Oregon
- % of Population on Food Stamps or SNAP (Last 12 Months), by Zip Code (ZCTA5) — Ohio
- % of Population on Food Stamps or SNAP (Last 12 Months), by Zip Code (ZCTA5) — Montana
- % of Population on Food Stamps or SNAP (Last 12 Months), by Zip Code (ZCTA5) — Iowa
- % of Population on Food Stamps or SNAP (Last 12 Months), by Zip Code (ZCTA5) — Utah
- % of Population on Food Stamps or SNAP (Last 12 Months), by Zip Code (ZCTA5) — Maine
- % of Population on Food Stamps or SNAP (Last 12 Months), by Zip Code (ZCTA5) — Arizona
- % of Population on Food Stamps or SNAP (Last 12 Months), by Zip Code (ZCTA5) — Oklahoma
- % of Population on Food Stamps or SNAP (Last 12 Months), by Zip Code (ZCTA5) — Idaho