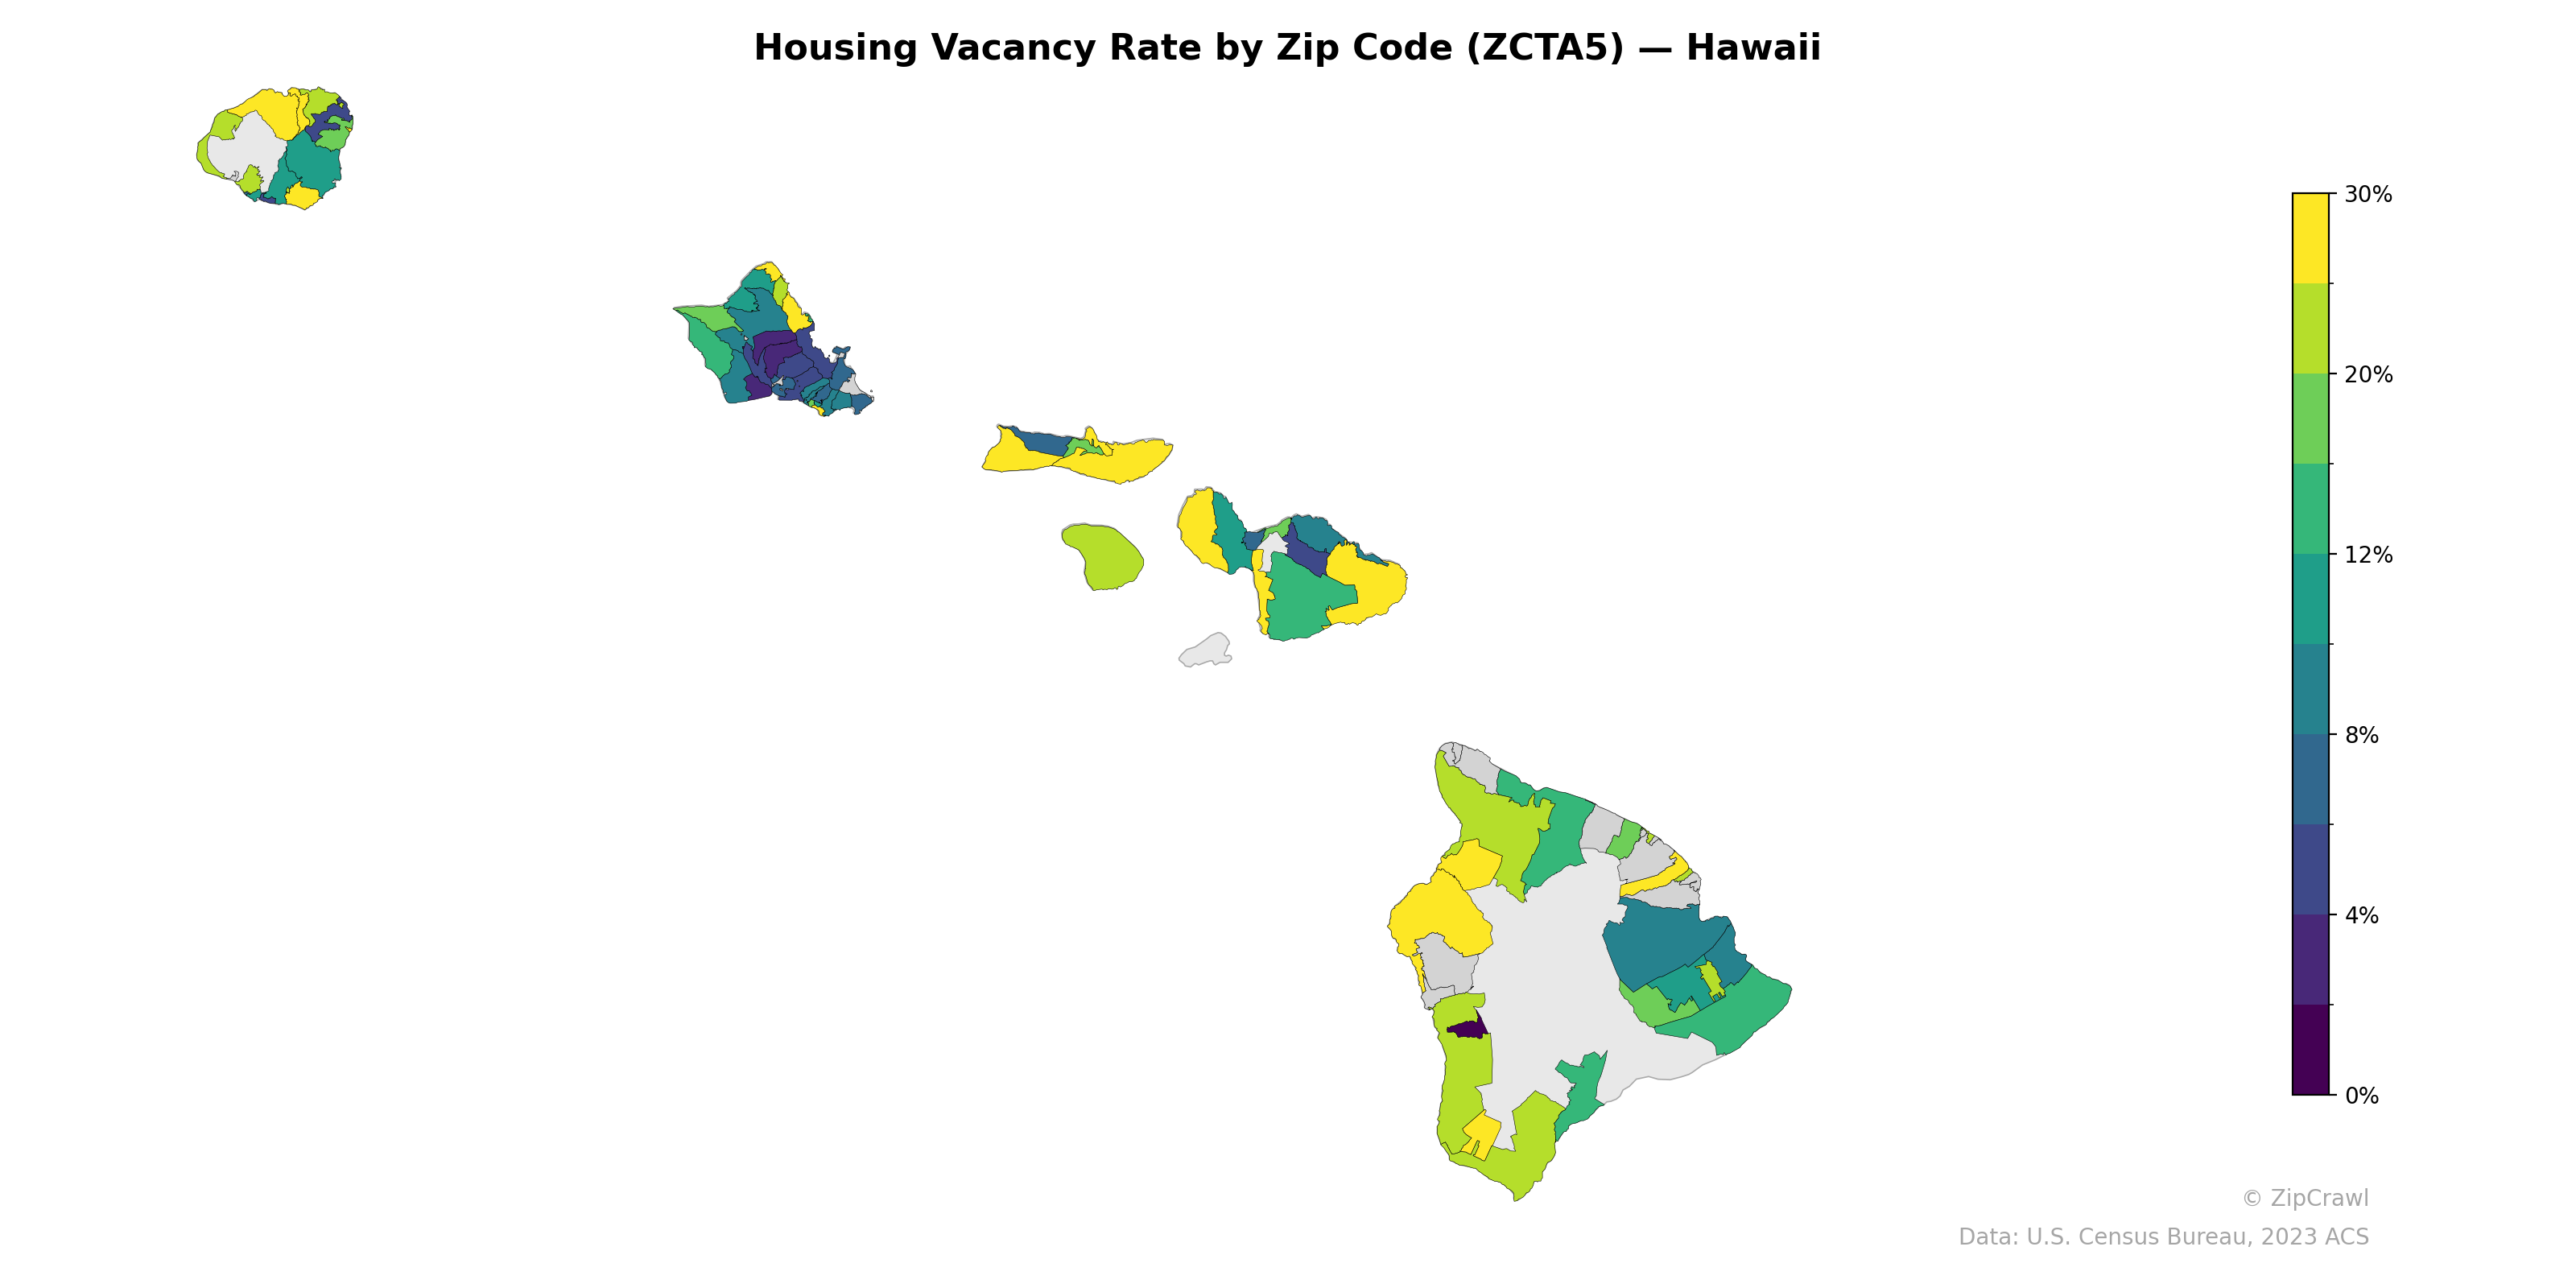
NOTE: Gray indicates insufficient data or a suppressed estimate.
Resort-heavy zip codes on Maui's western coast and portions of the Big Island's Kona-Kohala coast exhibit the highest vacancy rates, exceeding 20–30%, consistent with concentrations of vacation and seasonal-use properties. In contrast, urban Honolulu zip codes on Oahu's southern shore register among the lowest vacancy rates statewide, generally below 4%, reflecting tight primary housing markets. Kauai displays notable intra-island variation, with the north shore trending toward higher vacancy rates while interior and eastern areas remain comparatively lower.
Data: U.S. Census Bureau, 2023 ACS
Explore
- Household Median Income by Zip Code (ZCTA5) — New York
- Population Non-Hispanic Black % by Zip Code (ZCTA5) — New Hampshire
- Median Age by Zip Code (ZCTA5) — New Hampshire
- % of Population on Food Stamps or SNAP (Last 12 Months), by Zip Code (ZCTA5) — Hawaii
- Population Hispanic % by Zip Code (ZCTA5) — New Hampshire
- Population Non-Hispanic White % by Zip Code (ZCTA5) — New Hampshire
- Household Median Income by Zip Code (ZCTA5) — New Hampshire
- U.S. Citizens (% of Population Over 18) by Zip Code (ZCTA5) — New Hampshire
- Married Couple (% of all Households) by Zip Code (ZCTA5) — Hawaii
- Population Non-Hispanic Asian % by Zip Code (ZCTA5) — Hawaii
- U.S. Citizens by County (% of Population Over 18)
- High School Graduate (% of Over 25) by Zip Code (ZCTA5) — New York
- % of Households with Broadband Internet, by Zip Code (ZCTA5) — Phoenix Metro
- Population Non-Hispanic American Indian % by Zip Code (ZCTA5) — New York
- Median Age by Zip Code (ZCTA5) — New York
- U.S. Citizens (% of Population Over 18) by Zip Code (ZCTA5) — New York
- Population Non-Hispanic White % by Zip Code (ZCTA5) — New York
- Population Hispanic % by Zip Code (ZCTA5) — New York
- % of Households with Broadband Internet, by Zip Code (ZCTA5) — Florida
- % of Population on Food Stamps or SNAP (Last 12 Months), by Zip Code (ZCTA5) — Florida
- Population Non-Hispanic Asian % by Zip Code (ZCTA5) — Florida
- Population Non-Hispanic Black % by Zip Code (ZCTA5) — New York
- % of Population without Health Insurance, by Zip Code (ZCTA5) — West Virginia
- Bachelor's Degree or Higher (% of Over 25) by Zip Code (ZCTA5) — West Virginia
- Population Non-Hispanic Asian % by Zip Code (ZCTA5) — West Virginia
- Housing Owner-Occupied % of Units, by Zip Code (ZCTA5) — West Virginia
- Population Hispanic % by Zip Code (ZCTA5) — Hawaii
- High School Graduate (% of Over 25) by Zip Code (ZCTA5) — West Virginia
- % of Households with Broadband Internet, by Zip Code (ZCTA5) — West Virginia
- Population Non-Hispanic American Indian % by Zip Code (ZCTA5) — West Virginia
- Housing Vacancy Rate by Zip Code (ZCTA5) — Ohio
- Housing Vacancy Rate by Zip Code (ZCTA5) — Utah
- Housing Vacancy Rate by Zip Code (ZCTA5) — Iowa
- Housing Vacancy Rate by Zip Code (ZCTA5) — Wyoming
- Housing Vacancy Rate by Zip Code (ZCTA5) — Idaho
- Housing Vacancy Rate by Zip Code (ZCTA5) — Maine
- Housing Vacancy Rate by Zip Code (ZCTA5) — Texas
- Housing Vacancy Rate by Zip Code (ZCTA5) — Delaware
- Housing Vacancy Rate by Zip Code (ZCTA5) — Alaska
- Housing Vacancy Rate by Zip Code (ZCTA5) — Nevada