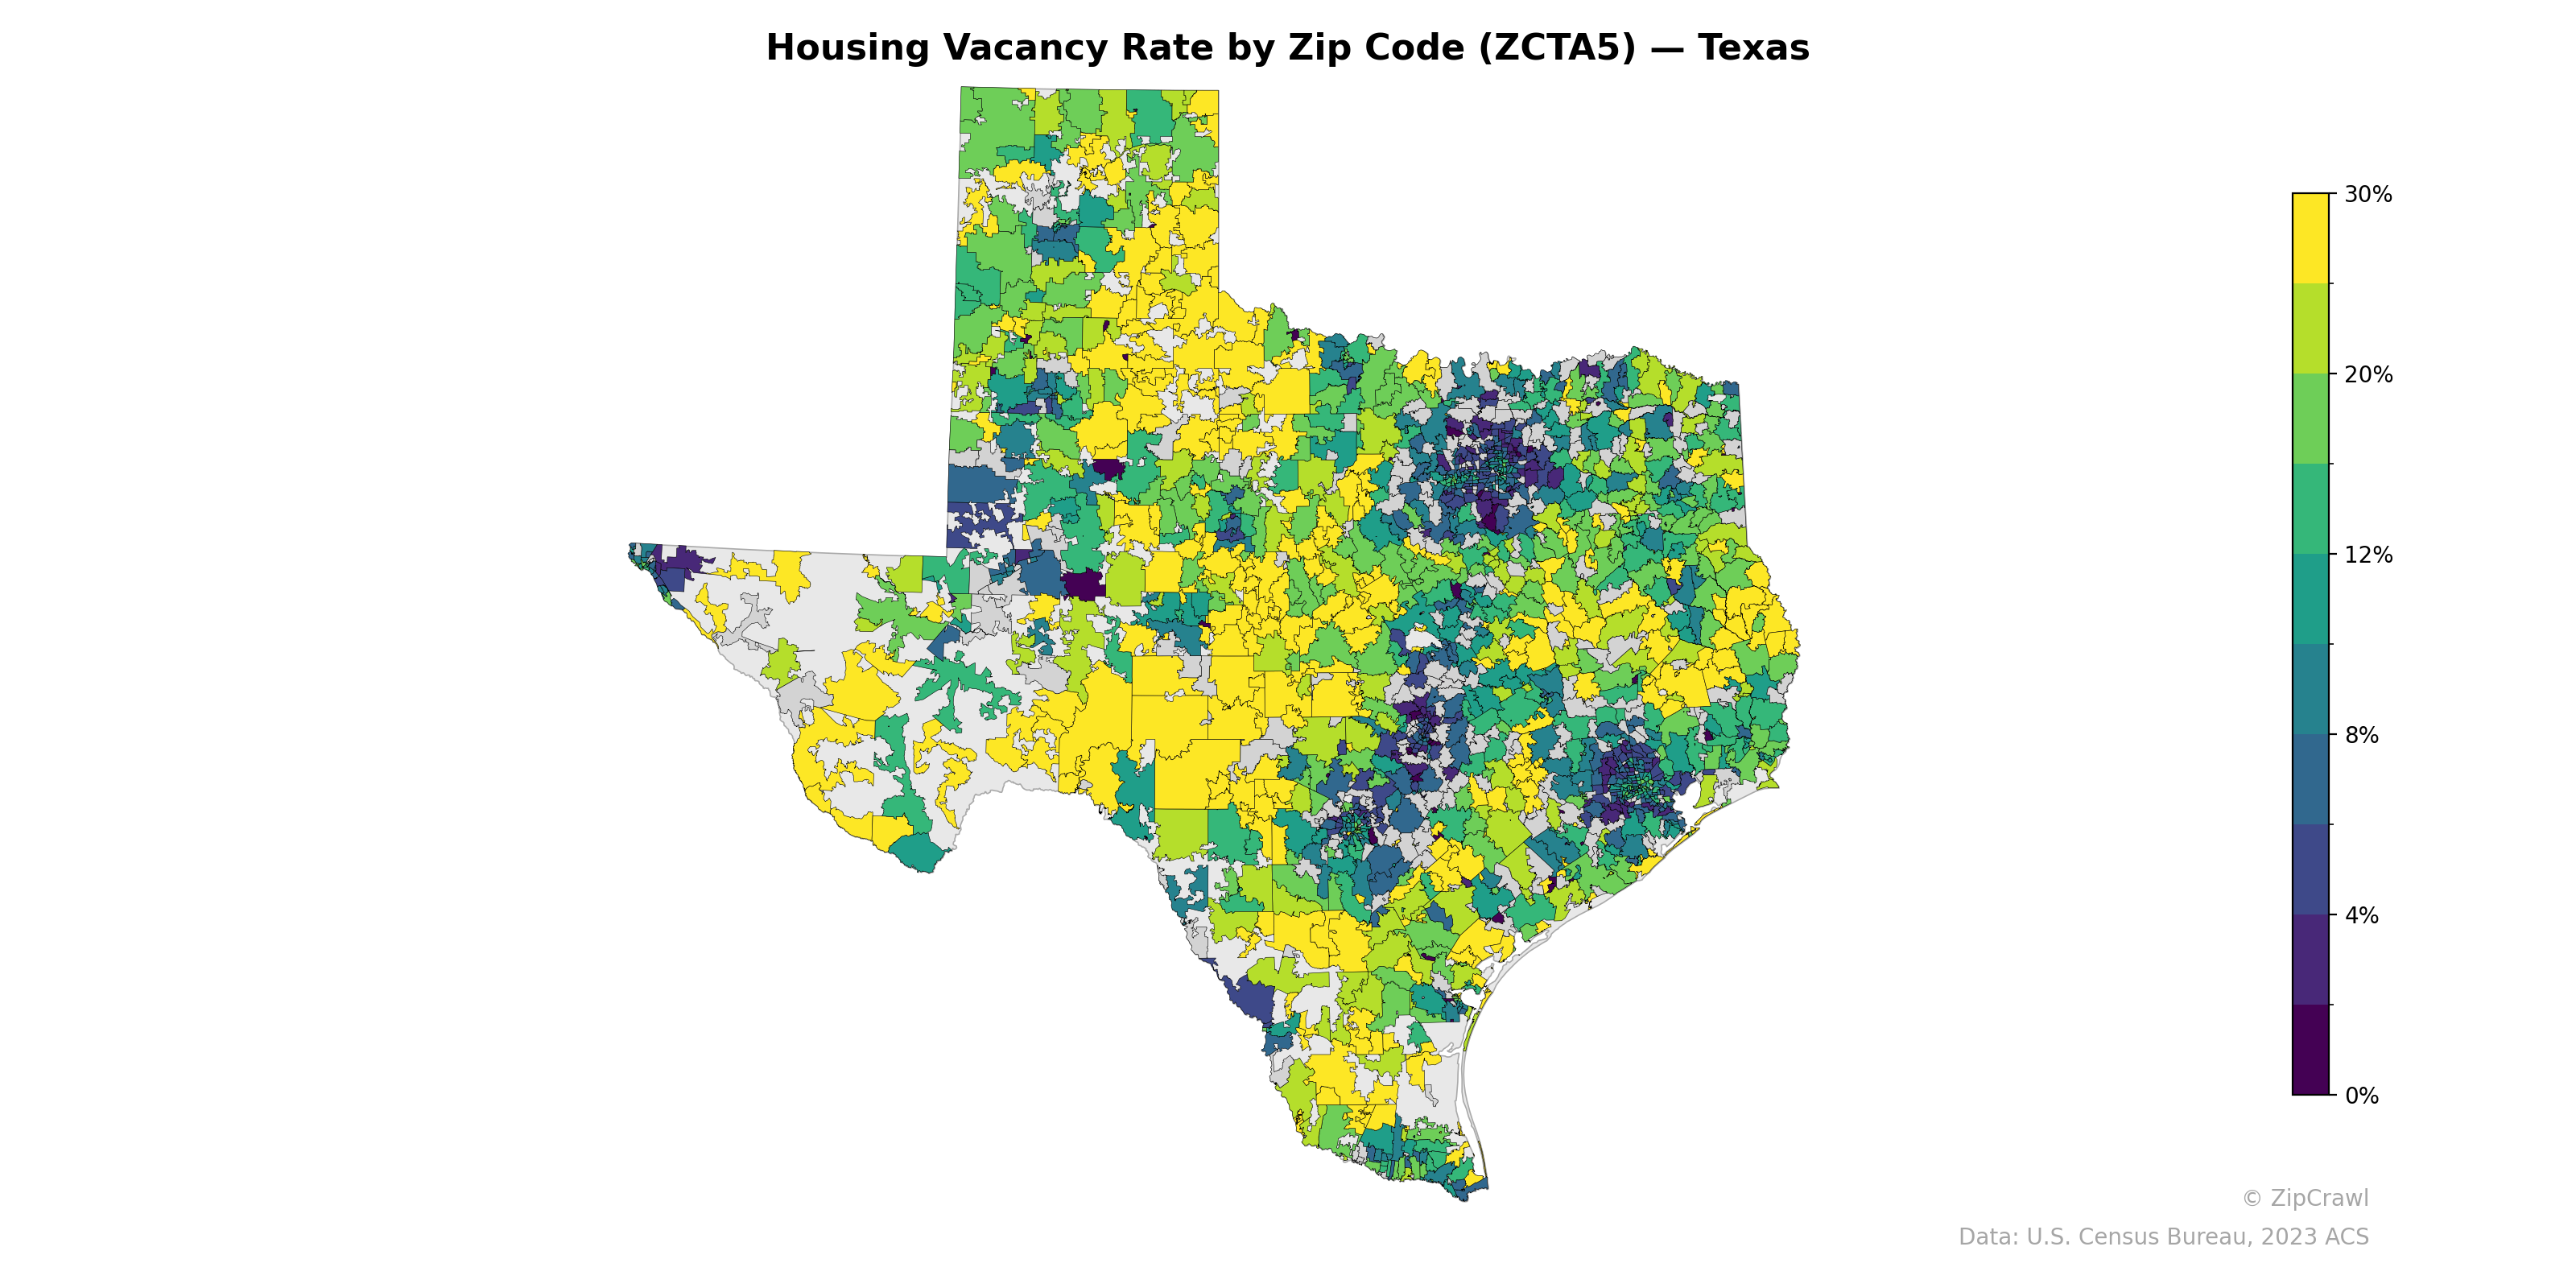
NOTE: Gray indicates insufficient data or a suppressed estimate.
Housing vacancy rates across Texas exhibit a clear urban-suburban divide, with major metro cores—particularly the Dallas-Fort Worth, Houston, San Antonio, and Austin areas—displaying notably lower vacancy rates (dark purple and blue tones, under 4%), reflecting sustained housing demand in these high-growth markets. The Texas Panhandle and western regions show considerably higher vacancy rates, frequently exceeding 20%, likely driven by rural depopulation and the cyclical nature of energy-sector employment in the Permian Basin area. Coastal zip codes along the Gulf, especially near Galveston and the lower Rio Grande Valley, display a mixed pattern with pockets of elevated vacancy that may reflect seasonal or vacation housing stock alongside economically distressed communities.
Data: U.S. Census Bureau, 2023 ACS
Explore
- Population Non-Hispanic Black % by Zip Code (ZCTA5) — Alabama
- U.S. Citizens (% of Population Over 18) by Zip Code (ZCTA5) — Alabama
- Population Hispanic % by Zip Code (ZCTA5) — Alabama
- Median Age by Zip Code (ZCTA5) — Alabama
- Population Non-Hispanic White % by Zip Code (ZCTA5) — Alabama
- Household Median Income by Zip Code (ZCTA5) — Alabama
- Bachelor's Degree or Higher (% of Over 25) by County
- Bachelor's Degree or Higher (% of Over 25) by Zip Code (ZCTA5) — Texas
- Married Couple (% of all Households) by Zip Code (ZCTA5) — Texas
- Household Average Size by Zip Code (ZCTA5) — Texas
- Housing Median Monthly Rent ($), by Zip Code (ZCTA5) — Texas
- Housing Owner-Occupied Median Value ($), by Zip Code (ZCTA5) — Texas
- Housing % of Units Built Since 2010, by Zip Code (ZCTA5) — Texas
- % of Households with Broadband Internet, by Zip Code (ZCTA5) — Texas
- % of Population without Health Insurance, by Zip Code (ZCTA5) — Texas
- Housing Owner-Occupied % of Units, by Zip Code (ZCTA5) — Texas
- % of Population on Food Stamps or SNAP (Last 12 Months), by Zip Code (ZCTA5) — Wisconsin
- High School Graduate (% of Over 25) by Zip Code (ZCTA5) — Wisconsin
- U.S. Citizens (% of Population Over 18) by Zip Code (ZCTA5) — Colorado
- Population Non-Hispanic Black % by Zip Code (ZCTA5) — Wisconsin
- Population Non-Hispanic White % by Zip Code (ZCTA5) — Wisconsin
- Household Median Income by Zip Code (ZCTA5) — Colorado
- Household Average Size by Zip Code (ZCTA5) — Wisconsin
- Median Age by Zip Code (ZCTA5) — Wisconsin
- Married Couple (% of all Households) by Zip Code (ZCTA5) — Wisconsin
- Population Non-Hispanic American Indian % by Zip Code (ZCTA5) — Wisconsin
- Population Hispanic % by Zip Code (ZCTA5) — Wisconsin
- Bachelor's Degree or Higher (% of Over 25) by Zip Code (ZCTA5) — Wisconsin
- Housing % of Units Built Since 2010, by Zip Code (ZCTA5) — Wisconsin
- Population Non-Hispanic Asian % by Zip Code (ZCTA5) — Wisconsin
- Housing Vacancy Rate by Zip Code (ZCTA5) — Kansas
- Housing Vacancy Rate by Zip Code (ZCTA5) — Ohio
- Housing Vacancy Rate by Zip Code (ZCTA5) — Utah
- Housing Vacancy Rate by Zip Code (ZCTA5) — Iowa
- Housing Vacancy Rate by Zip Code (ZCTA5) — Tennessee
- Housing Vacancy Rate by Zip Code (ZCTA5) — Maine
- Housing Vacancy Rate by Zip Code (ZCTA5) — Hawaii
- Housing Vacancy Rate by Zip Code (ZCTA5) — Wyoming
- Housing Vacancy Rate by Zip Code (ZCTA5) — Idaho
- Housing Vacancy Rate by Zip Code (ZCTA5) — Arkansas