NOTE: Gray indicates insufficient data or a suppressed estimate.
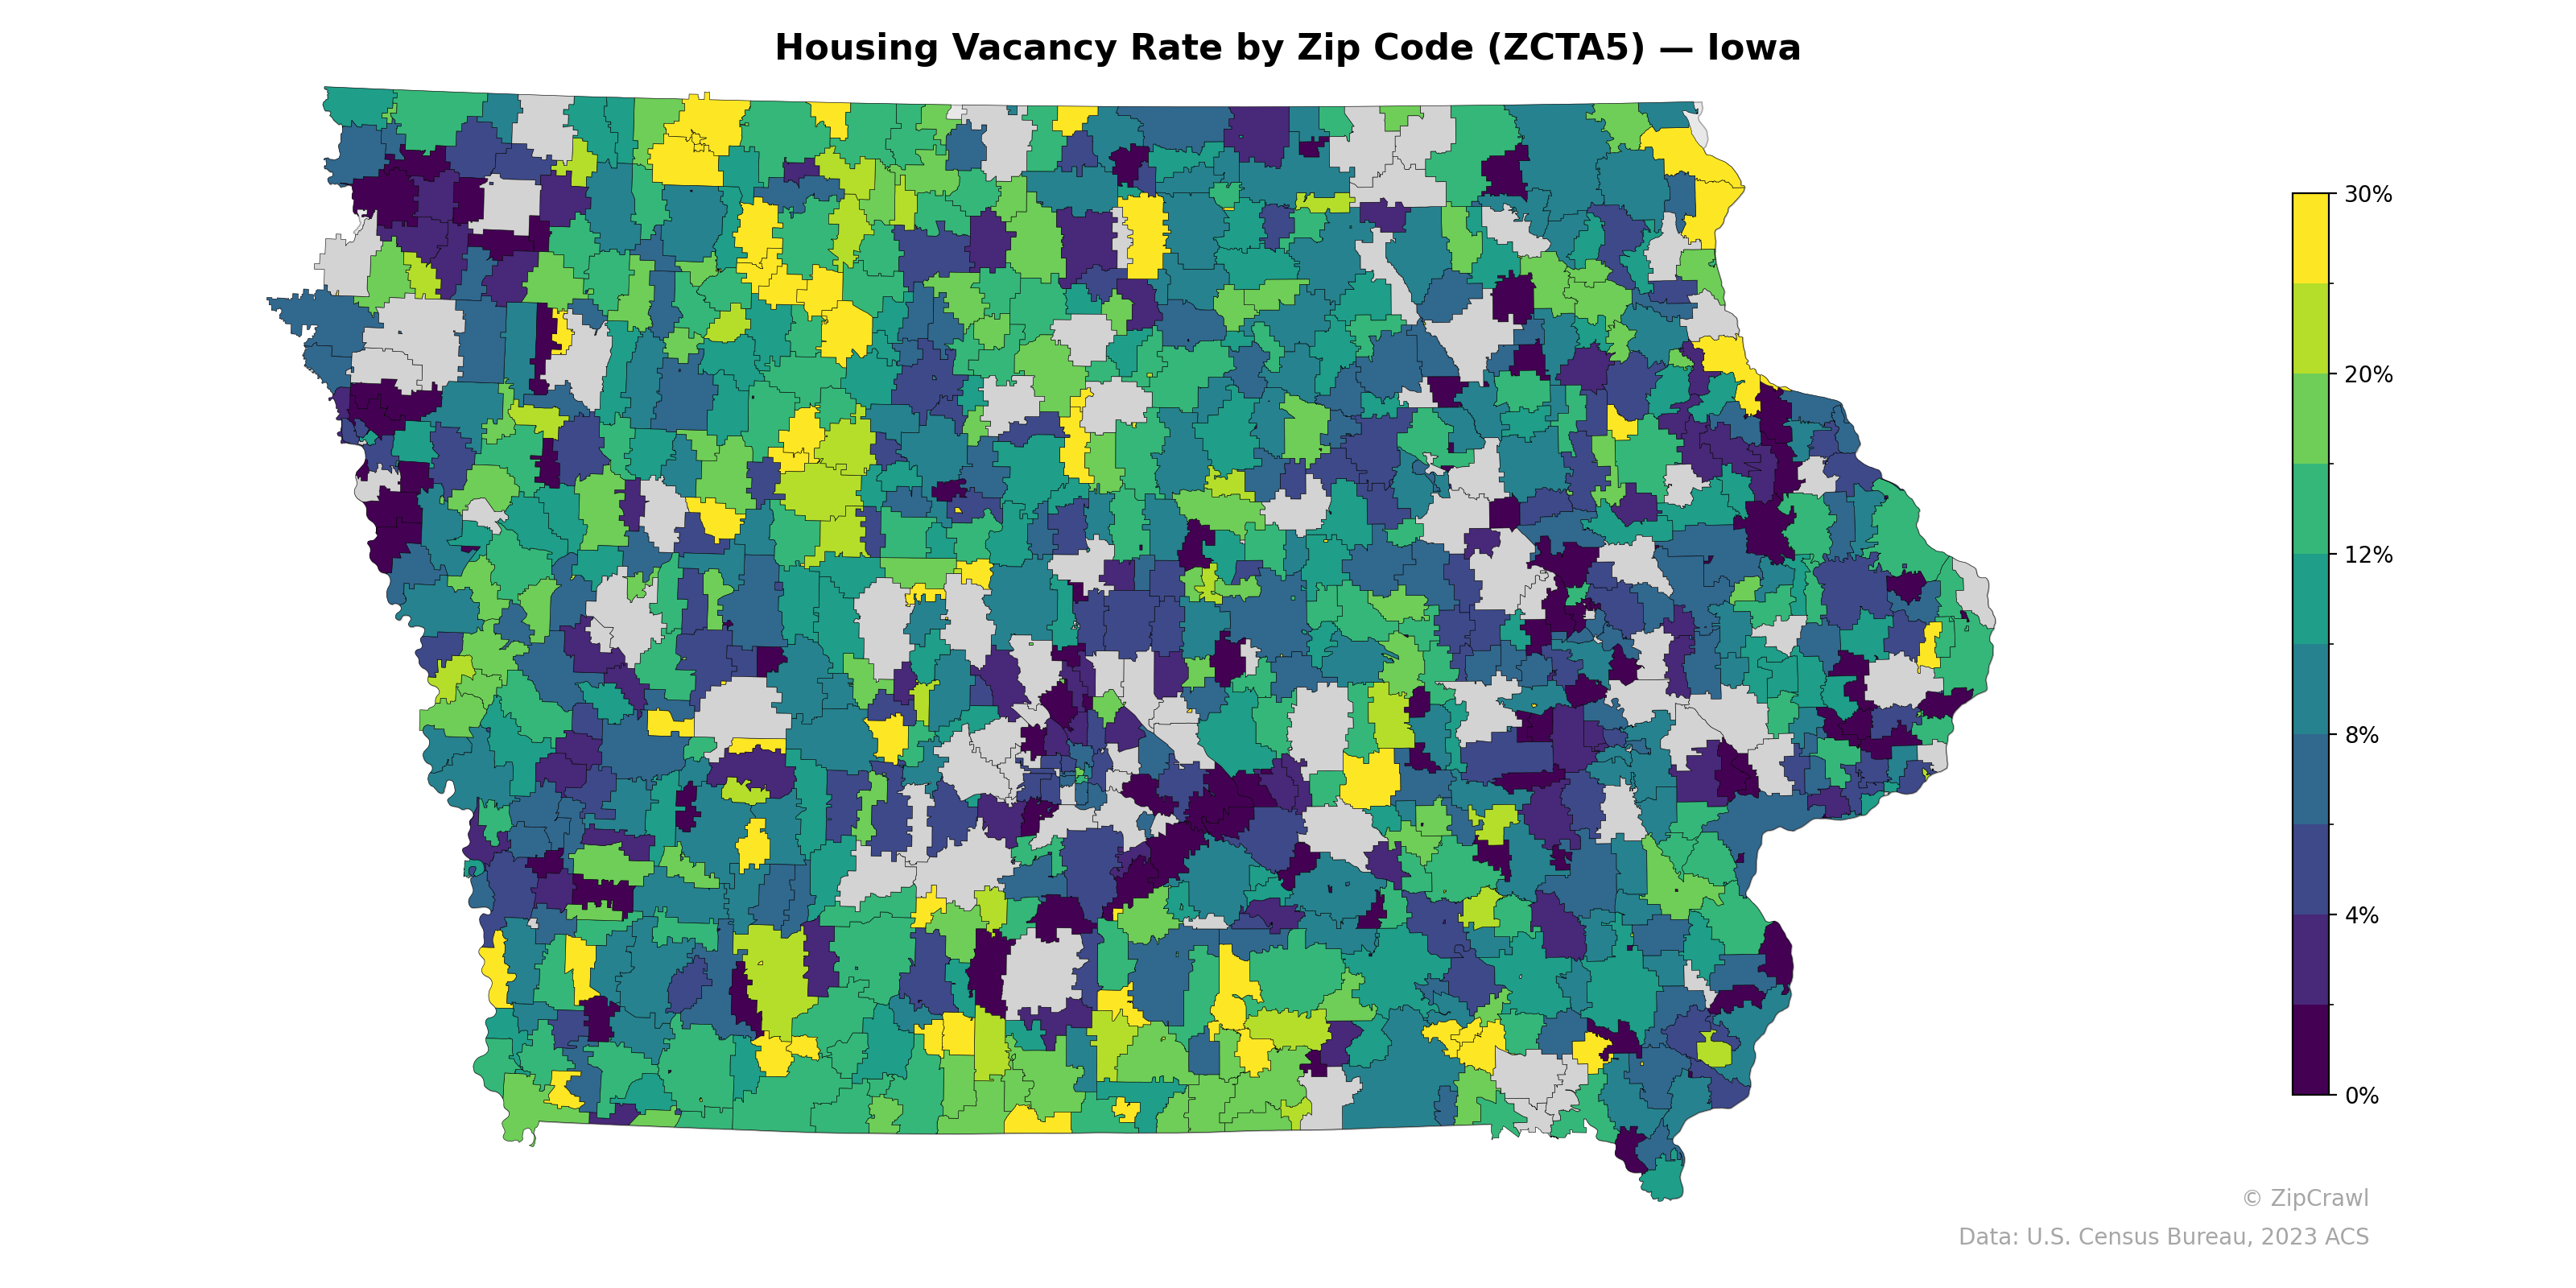
Housing vacancy rates across Iowa's zip codes display considerable heterogeneity, with no single dominant regional pattern, though notably higher vacancy rates (20–30%+) appear concentrated in scattered rural zip codes throughout the northwestern and north-central portions of the state. The lowest vacancy rates (0–4%, shown in dark purple) cluster around major metropolitan areas, likely corresponding to Des Moines, Cedar Rapids, Iowa City, and the Quad Cities, where housing demand remains strongest. A patchwork of moderate vacancy (8–12%) characterizes much of southern Iowa, reflecting the region's ongoing population decline and slower economic growth relative to the state's urban corridors.
Data: U.S. Census Bureau, 2023 ACS
Explore
- Population Non-Hispanic White % by Zip Code (ZCTA5) — Florida
- Population Non-Hispanic White % by Zip Code (ZCTA5) — Nevada
- Median Age by Zip Code (ZCTA5) — Nevada
- % of Population on Food Stamps or SNAP (Last 12 Months), by Zip Code (ZCTA5) — Iowa
- Population Hispanic % by Zip Code (ZCTA5) — Nevada
- Population Non-Hispanic Black % by Zip Code (ZCTA5) — Nevada
- Household Median Income by Zip Code (ZCTA5) — Nevada
- U.S. Citizens (% of Population Over 18) by Zip Code (ZCTA5) — Nevada
- Married Couple (% of all Households) by Zip Code (ZCTA5) — Iowa
- Population Non-Hispanic Asian % by Zip Code (ZCTA5) — Iowa
- Housing Owner-Occupied Median Value ($), by County
- % of Households with Broadband Internet, by Zip Code (ZCTA5) — Dallas Metro
- High School Graduate (% of Over 25) by Zip Code (ZCTA5) — Florida
- % of Households with Broadband Internet, by Zip Code (ZCTA5) — New York
- Population Hispanic % by Zip Code (ZCTA5) — Florida
- Median Age by Zip Code (ZCTA5) — Florida
- Population Non-Hispanic Black % by Zip Code (ZCTA5) — Florida
- Population Non-Hispanic Asian % by Zip Code (ZCTA5) — California
- % of Population on Food Stamps or SNAP (Last 12 Months), by Zip Code (ZCTA5) — California
- Household Median Income by Zip Code (ZCTA5) — Florida
- U.S. Citizens (% of Population Over 18) by Zip Code (ZCTA5) — Florida
- Population Non-Hispanic American Indian % by Zip Code (ZCTA5) — Florida
- Housing % of Units Built Since 2010, by Zip Code (ZCTA5) — Connecticut
- Population Non-Hispanic American Indian % by Zip Code (ZCTA5) — Connecticut
- Household Average Size by Zip Code (ZCTA5) — Connecticut
- Housing Median Monthly Rent ($), by Zip Code (ZCTA5) — Nevada
- Population Hispanic % by Zip Code (ZCTA5) — Mississippi
- Household Median Income by Zip Code (ZCTA5) — Iowa
- Median Age by Zip Code (ZCTA5) — Iowa
- High School Graduate (% of Over 25) by Zip Code (ZCTA5) — Connecticut
- Housing Vacancy Rate by Zip Code (ZCTA5) — Idaho
- Housing Vacancy Rate by Zip Code (ZCTA5) — Utah
- Housing Vacancy Rate by Zip Code (ZCTA5) — Ohio
- Housing Vacancy Rate by Zip Code (ZCTA5) — Indiana
- Housing Vacancy Rate by Zip Code (ZCTA5) — Wyoming
- Housing Vacancy Rate by Zip Code (ZCTA5) — Maine
- Housing Vacancy Rate by Zip Code (ZCTA5) — Texas
- Housing Vacancy Rate by Zip Code (ZCTA5) — Hawaii
- Housing Vacancy Rate by Zip Code (ZCTA5) — Illinois
- Housing Vacancy Rate by Zip Code (ZCTA5) — Nevada