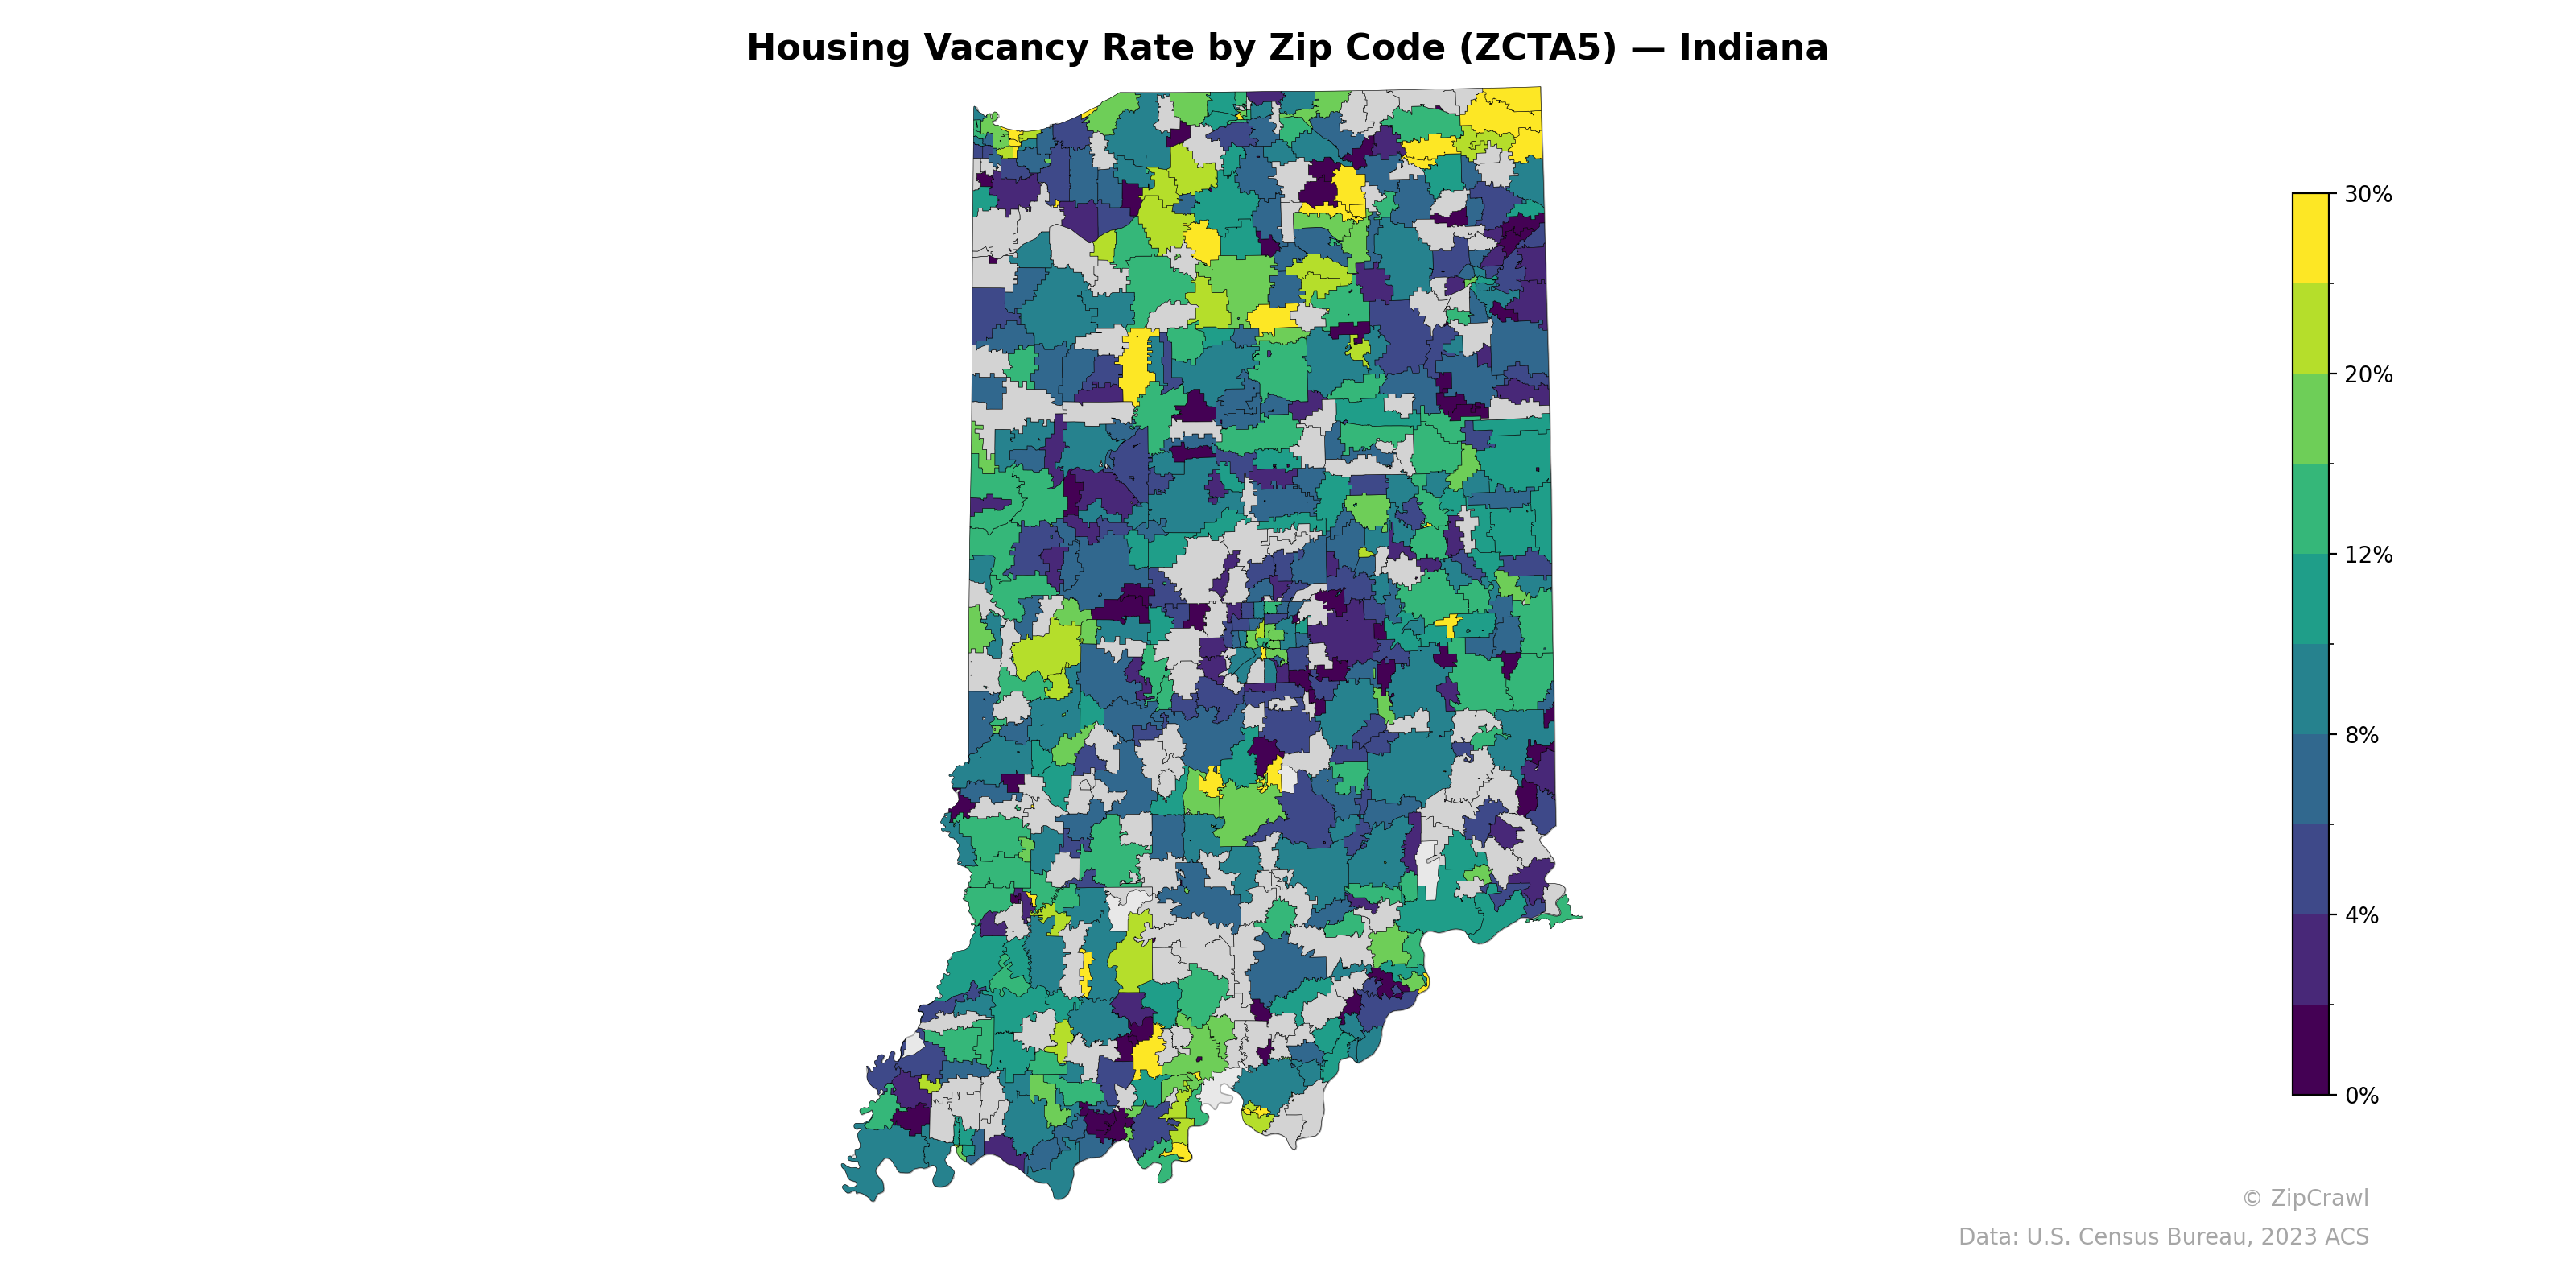
NOTE: Gray indicates insufficient data or a suppressed estimate.
Housing vacancy rates across Indiana exhibit notable geographic variation, with the highest concentrations (20–30%+) clustered in the rural southern counties along the Ohio River corridor and scattered areas of northern Indiana near the Michigan border. The Indianapolis metropolitan area and surrounding suburban zip codes in central Indiana generally display lower vacancy rates in the 4–8% range, consistent with stronger housing demand in the state's economic core. A band of moderate-to-high vacancy (12–20%) is visible across much of rural west-central and east-central Indiana, suggesting persistent population decline in smaller communities outside major employment centers.
Data: U.S. Census Bureau, 2023 ACS
Explore
- Housing Median Monthly Rent ($), by Zip Code (ZCTA5) — Los Angeles Metro
- Household Average Size by Zip Code (ZCTA5) — Indiana
- Housing Owner-Occupied % of Units, by Zip Code (ZCTA5) — Indiana
- Housing Median Monthly Rent ($), by Zip Code (ZCTA5) — Indiana
- Bachelor's Degree or Higher (% of Over 25) by Zip Code (ZCTA5) — Indiana
- % of Households with Broadband Internet, by Zip Code (ZCTA5) — Indiana
- Housing % of Units Built Since 2010, by Zip Code (ZCTA5) — Indiana
- Married Couple (% of all Households) by Zip Code (ZCTA5) — Indiana
- Housing Owner-Occupied Median Value ($), by Zip Code (ZCTA5) — Indiana
- % of Population without Health Insurance, by Zip Code (ZCTA5) — Indiana
- Population Non-Hispanic Black % by Zip Code (ZCTA5) — North Dakota
- Population Non-Hispanic Black % by County
- Household Average Size by Zip Code (ZCTA5) — Los Angeles Metro
- Married Couple (% of all Households) by Zip Code (ZCTA5) — Los Angeles Metro
- Housing Owner-Occupied % of Units, by Zip Code (ZCTA5) — Los Angeles Metro
- % of Households with Broadband Internet, by Zip Code (ZCTA5) — Los Angeles Metro
- Bachelor's Degree or Higher (% of Over 25) by Zip Code (ZCTA5) — Los Angeles Metro
- Housing Owner-Occupied Median Value ($), by Zip Code (ZCTA5) — Los Angeles Metro
- % of Population without Health Insurance, by Zip Code (ZCTA5) — Los Angeles Metro
- Housing % of Units Built Since 2010, by Zip Code (ZCTA5) — Los Angeles Metro
- Housing Median Monthly Rent ($), by Zip Code (ZCTA5) — Tennessee
- Housing Owner-Occupied % of Units, by Zip Code (ZCTA5) — Tennessee
- Housing % of Units Built Since 2010, by Zip Code (ZCTA5) — Tennessee
- Population Non-Hispanic American Indian % by Zip Code (ZCTA5) — Tennessee
- Population Non-Hispanic Black % by Zip Code (ZCTA5) — Wisconsin
- High School Graduate (% of Over 25) by Zip Code (ZCTA5) — Tennessee
- % of Households with Broadband Internet, by Zip Code (ZCTA5) — Tennessee
- % of Population without Health Insurance, by Zip Code (ZCTA5) — Tennessee
- Housing Owner-Occupied Median Value ($), by Zip Code (ZCTA5) — Tennessee
- Population Hispanic % by Zip Code (ZCTA5) — Tennessee
- Housing Vacancy Rate by Zip Code (ZCTA5) — Iowa
- Housing Vacancy Rate by Zip Code (ZCTA5) — Louisiana
- Housing Vacancy Rate by Zip Code (ZCTA5) — Montana
- Housing Vacancy Rate by Zip Code (ZCTA5) — Idaho
- Housing Vacancy Rate by Zip Code (ZCTA5) — Utah
- Housing Vacancy Rate by Zip Code (ZCTA5) — Ohio
- Housing Vacancy Rate by Zip Code (ZCTA5) — Arizona
- Housing Vacancy Rate by Zip Code (ZCTA5) — Hawaii
- Housing Vacancy Rate by Zip Code (ZCTA5) — Texas
- Housing Vacancy Rate by Zip Code (ZCTA5) — Maine