NOTE: Gray indicates insufficient data or a suppressed estimate.
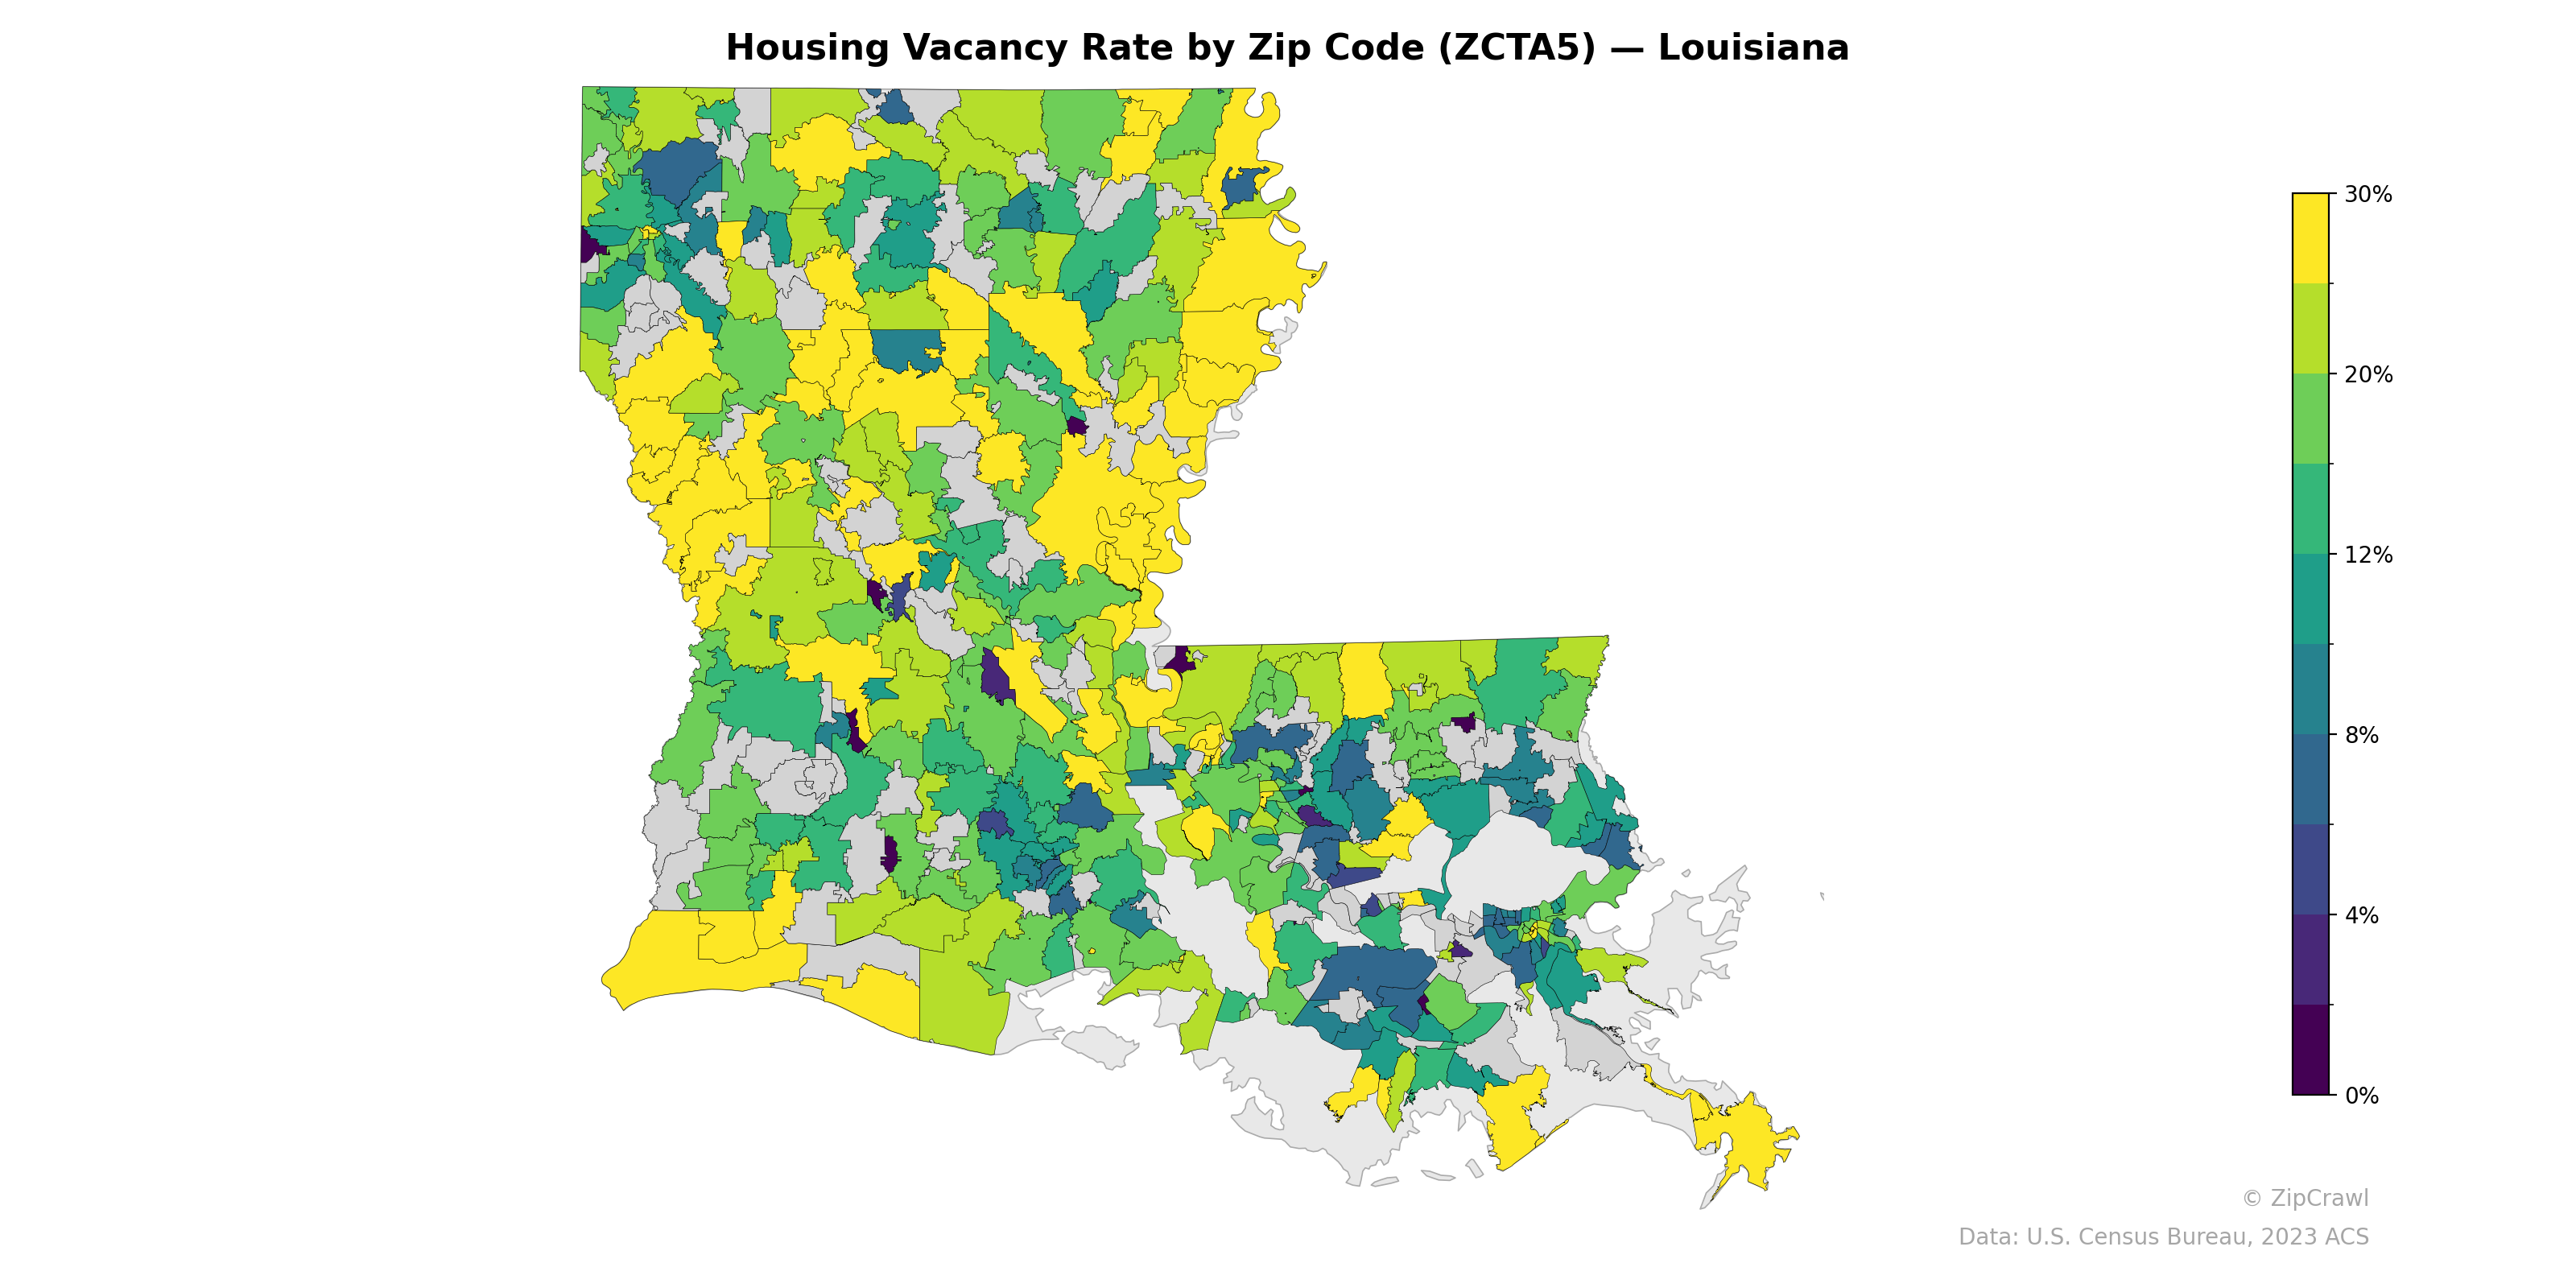
Housing vacancy rates across Louisiana exhibit a pronounced north-south gradient, with the highest concentrations (20–30%+) clustered in the rural central and north-central parishes, particularly in the Mississippi Delta region and areas west of Monroe. The greater New Orleans metropolitan area in the southeast displays notably lower vacancy rates, generally below 8%, though several isolated zip codes within the city register near-zero rates characteristic of dense urban cores. Southwestern Louisiana around the Lake Charles area and the Acadiana region show moderate vacancy rates in the 8–15% range, while scattered high-vacancy outliers in coastal zones likely reflect seasonal or storm-damaged housing stock.
Data: U.S. Census Bureau, 2023 ACS
Explore
- Household Median Income by Zip Code (ZCTA5) — California
- Population Non-Hispanic Asian % by Zip Code (ZCTA5) — Louisiana
- Population Non-Hispanic White % by Zip Code (ZCTA5) — Kentucky
- Married Couple (% of all Households) by Zip Code (ZCTA5) — Louisiana
- Population Hispanic % by Zip Code (ZCTA5) — Kentucky
- Population Non-Hispanic Black % by Zip Code (ZCTA5) — Kentucky
- Median Age by Zip Code (ZCTA5) — Kentucky
- % of Population on Food Stamps or SNAP (Last 12 Months), by Zip Code (ZCTA5) — Louisiana
- U.S. Citizens (% of Population Over 18) by Zip Code (ZCTA5) — Kentucky
- Household Median Income by Zip Code (ZCTA5) — Kentucky
- % of Households with Broadband Internet, by County
- Population Non-Hispanic American Indian % by Zip Code (ZCTA5) — California
- Population Non-Hispanic Black % by Zip Code (ZCTA5) — California
- Population Non-Hispanic White % by Zip Code (ZCTA5) — California
- Population Hispanic % by Zip Code (ZCTA5) — California
- U.S. Citizens (% of Population Over 18) by Zip Code (ZCTA5) — California
- Median Age by Zip Code (ZCTA5) — California
- % of Population on Food Stamps or SNAP (Last 12 Months), by Zip Code (ZCTA5) — Texas
- Population Non-Hispanic Asian % by Zip Code (ZCTA5) — Texas
- High School Graduate (% of Over 25) by Zip Code (ZCTA5) — California
- % of Households with Broadband Internet, by Zip Code (ZCTA5) — Florida
- Housing Median Monthly Rent ($), by Zip Code (ZCTA5) — Alabama
- Housing Owner-Occupied Median Value ($), by Zip Code (ZCTA5) — Alabama
- Housing % of Units Built Since 2010, by Zip Code (ZCTA5) — Alabama
- % of Households with Broadband Internet, by Zip Code (ZCTA5) — Alabama
- Married Couple (% of all Households) by Zip Code (ZCTA5) — Alabama
- % of Population on Food Stamps or SNAP (Last 12 Months), by Zip Code (ZCTA5) — Alabama
- Housing Owner-Occupied % of Units, by Zip Code (ZCTA5) — Alabama
- % of Population without Health Insurance, by Zip Code (ZCTA5) — Alabama
- Household Average Size by Zip Code (ZCTA5) — Alabama
- Housing Vacancy Rate by Zip Code (ZCTA5) — Indiana
- Housing Vacancy Rate by Zip Code (ZCTA5) — St. Louis Metro
- Housing Vacancy Rate by Zip Code (ZCTA5) — Montana
- Housing Vacancy Rate by Zip Code (ZCTA5) — Iowa
- Housing Vacancy Rate by Zip Code (ZCTA5) — Ohio
- Housing Vacancy Rate by Zip Code (ZCTA5) — Utah
- Housing Vacancy Rate by Zip Code (ZCTA5) — Arizona
- Housing Vacancy Rate by Zip Code (ZCTA5) — Idaho
- Housing Vacancy Rate by Zip Code (ZCTA5) — Texas
- Housing Vacancy Rate by Zip Code (ZCTA5) — Hawaii