NOTE: Gray indicates insufficient data or a suppressed estimate.
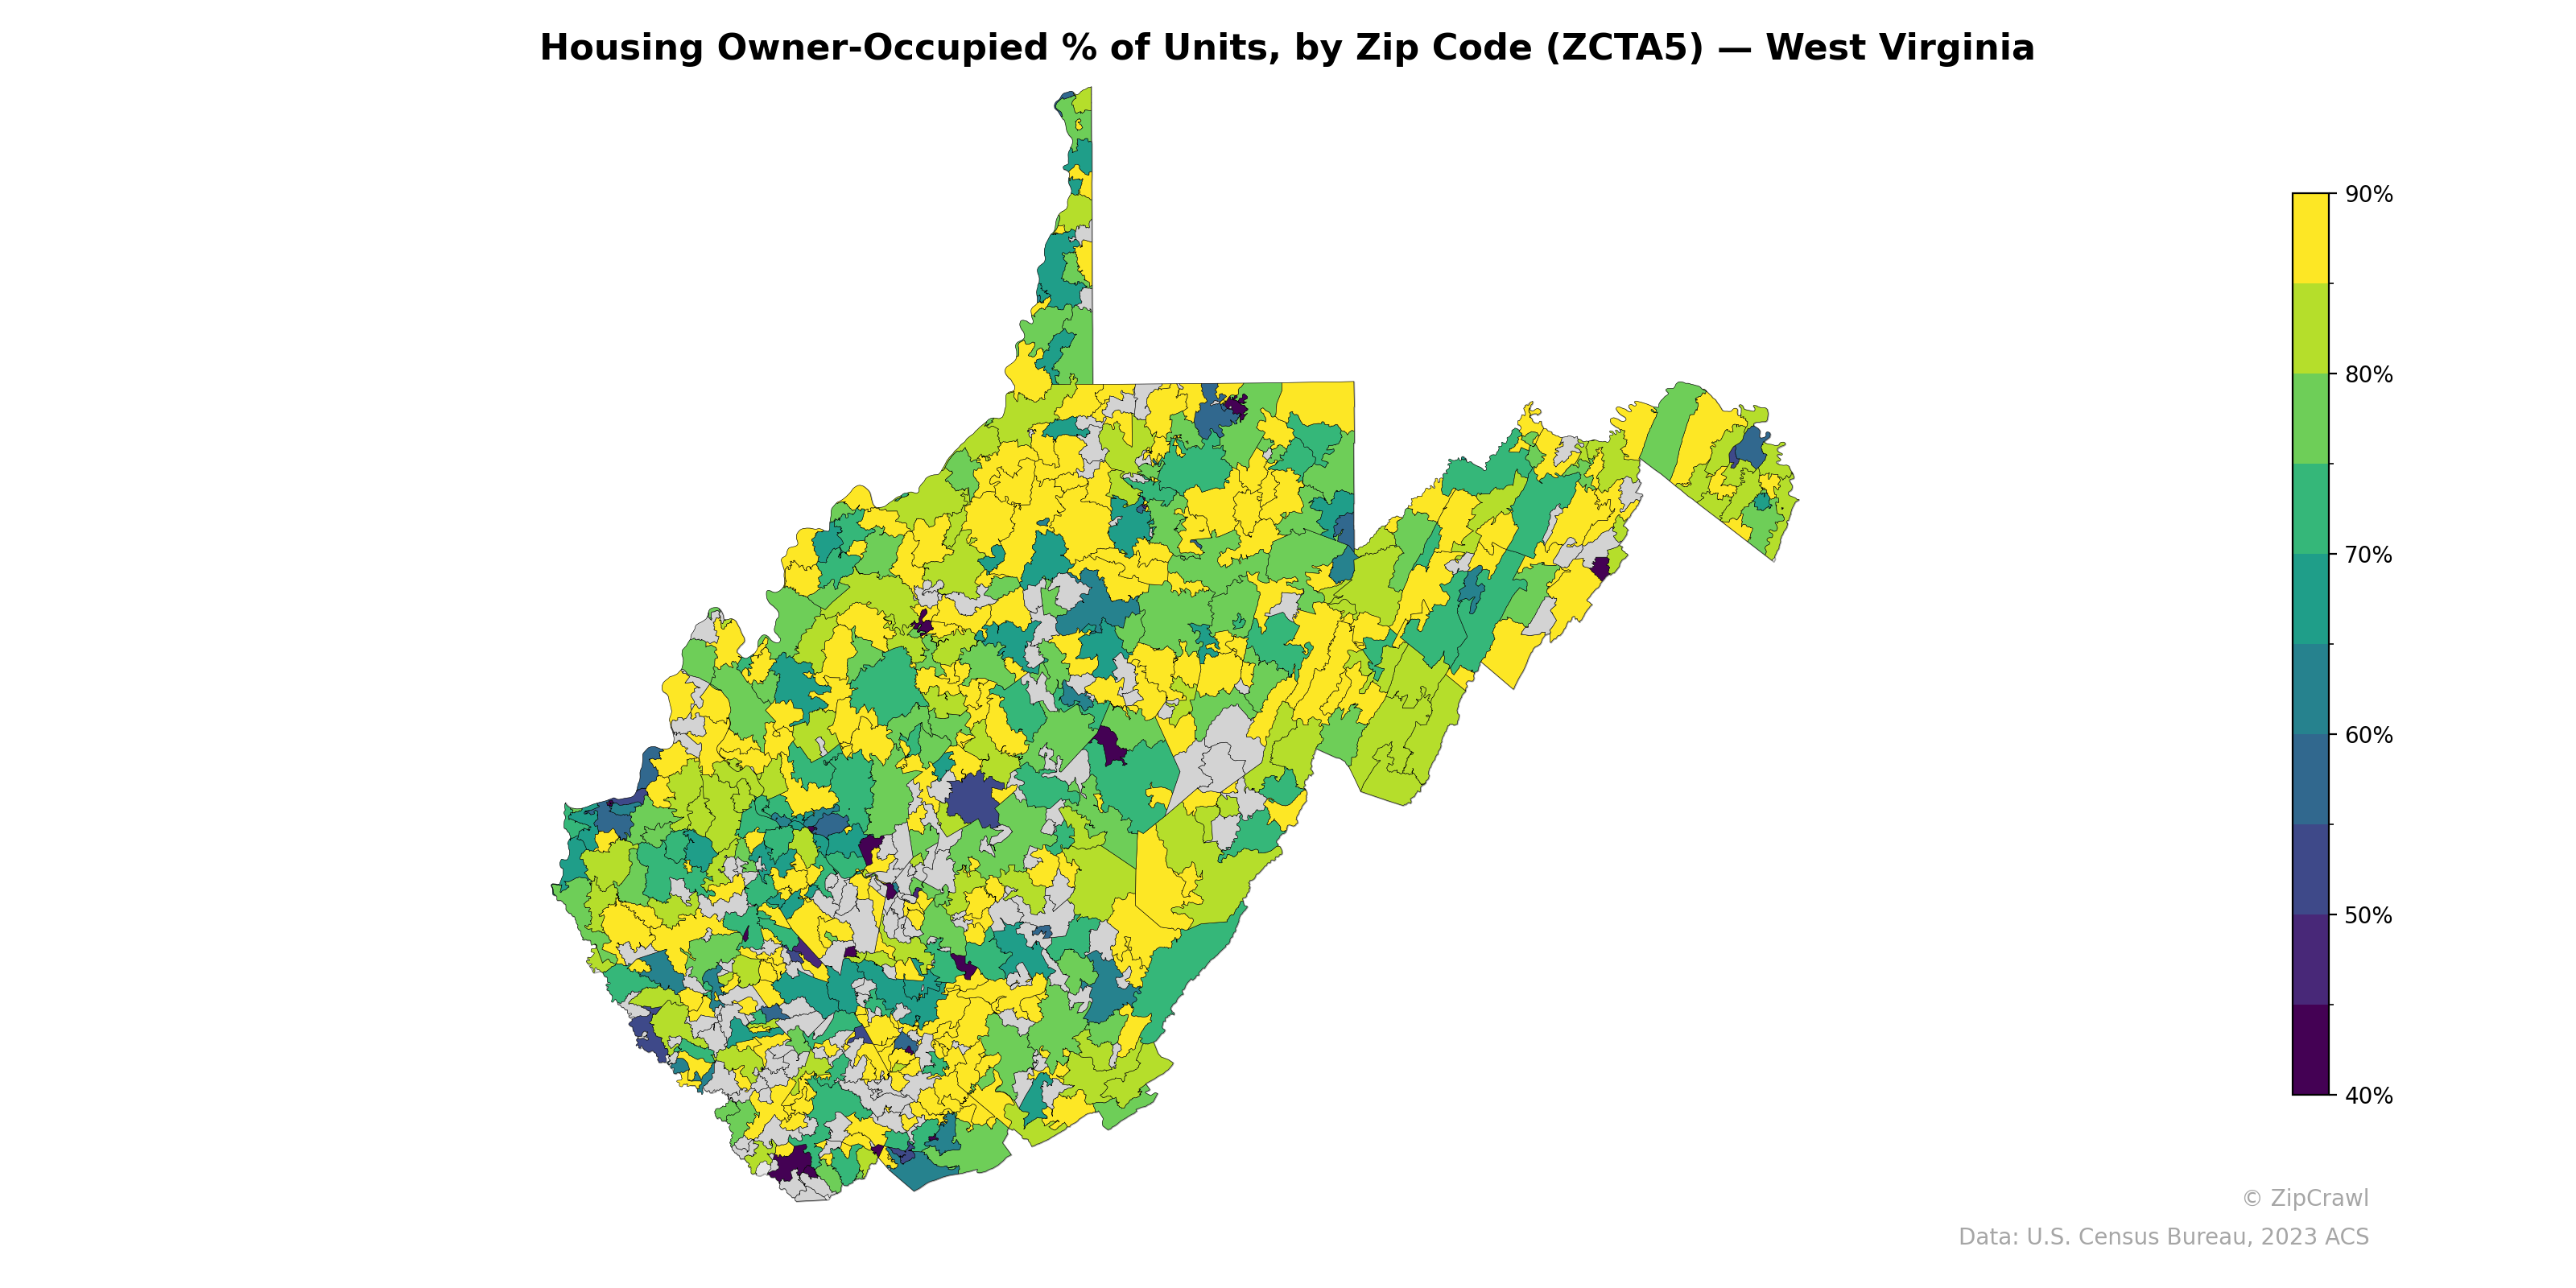
Owner-occupancy rates across West Virginia exhibit considerable spatial variation, with the highest concentrations (85–90%+) clustering in the rural eastern panhandle, the central highlands, and portions of the Ohio River valley, reflecting areas where single-family homeownership predominates. Urban centers and college towns—most notably the Charleston metro area, Morgantown, and Huntington—stand out as darker-hued pockets with owner-occupancy rates dropping below 50–60%, consistent with higher shares of rental housing stock. The southern coalfield counties display a more fragmented pattern, with a mix of moderate-to-high ownership rates interspersed with lower-ownership zip codes, likely reflecting economic variability and the presence of company-built or transitional housing in legacy mining communities.
Data: U.S. Census Bureau, 2023 ACS
Explore
- Population Non-Hispanic Asian % by Zip Code (ZCTA5) — Florida
- Bachelor's Degree or Higher (% of Over 25) by Zip Code (ZCTA5) — West Virginia
- High School Graduate (% of Over 25) by Zip Code (ZCTA5) — West Virginia
- % of Households with Broadband Internet, by Zip Code (ZCTA5) — West Virginia
- % of Population without Health Insurance, by Zip Code (ZCTA5) — West Virginia
- Population Non-Hispanic American Indian % by Zip Code (ZCTA5) — West Virginia
- Household Average Size by Zip Code (ZCTA5) — West Virginia
- Housing % of Units Built Since 2010, by Zip Code (ZCTA5) — West Virginia
- Housing Owner-Occupied Median Value ($), by Zip Code (ZCTA5) — West Virginia
- Housing Median Monthly Rent ($), by Zip Code (ZCTA5) — West Virginia
- U.S. Citizens by County (% of Population Over 18)
- Population Non-Hispanic White % by Zip Code (ZCTA5) — Philadelphia Metro
- Population Non-Hispanic American Indian % by Zip Code (ZCTA5) — New York
- High School Graduate (% of Over 25) by Zip Code (ZCTA5) — New York
- Median Age by Zip Code (ZCTA5) — New York
- U.S. Citizens (% of Population Over 18) by Zip Code (ZCTA5) — New York
- Population Non-Hispanic White % by Zip Code (ZCTA5) — New York
- Population Hispanic % by Zip Code (ZCTA5) — New York
- % of Population on Food Stamps or SNAP (Last 12 Months), by Zip Code (ZCTA5) — Florida
- Population Non-Hispanic White % by Zip Code (ZCTA5) — California
- Population Non-Hispanic Black % by Zip Code (ZCTA5) — New York
- Household Median Income by Zip Code (ZCTA5) — New York
- Housing Vacancy Rate by Zip Code (ZCTA5) — West Virginia
- Population Non-Hispanic Asian % by Zip Code (ZCTA5) — West Virginia
- Population Hispanic % by Zip Code (ZCTA5) — Hawaii
- Population Non-Hispanic Black % by Zip Code (ZCTA5) — Hawaii
- % of Population on Food Stamps or SNAP (Last 12 Months), by Zip Code (ZCTA5) — West Virginia
- Married Couple (% of all Households) by Zip Code (ZCTA5) — West Virginia
- U.S. Citizens (% of Population Over 18) by Zip Code (ZCTA5) — Hawaii
- Household Median Income by Zip Code (ZCTA5) — Hawaii
- Housing Owner-Occupied % of Units, by Zip Code (ZCTA5) — Virginia
- Housing Owner-Occupied % of Units, by Zip Code (ZCTA5) — Georgia
- Housing Owner-Occupied % of Units, by Zip Code (ZCTA5) — Wyoming
- Housing Owner-Occupied % of Units, by Zip Code (ZCTA5) — Utah
- Housing Owner-Occupied % of Units, by Zip Code (ZCTA5) — Ohio
- Housing Owner-Occupied % of Units, by Zip Code (ZCTA5) — Iowa
- Housing Owner-Occupied % of Units, by Zip Code (ZCTA5) — California
- Housing Owner-Occupied % of Units, by Zip Code (ZCTA5) — Vermont
- Housing Owner-Occupied % of Units, by Zip Code (ZCTA5) — Texas
- Housing Owner-Occupied % of Units, by Zip Code (ZCTA5) — Oregon