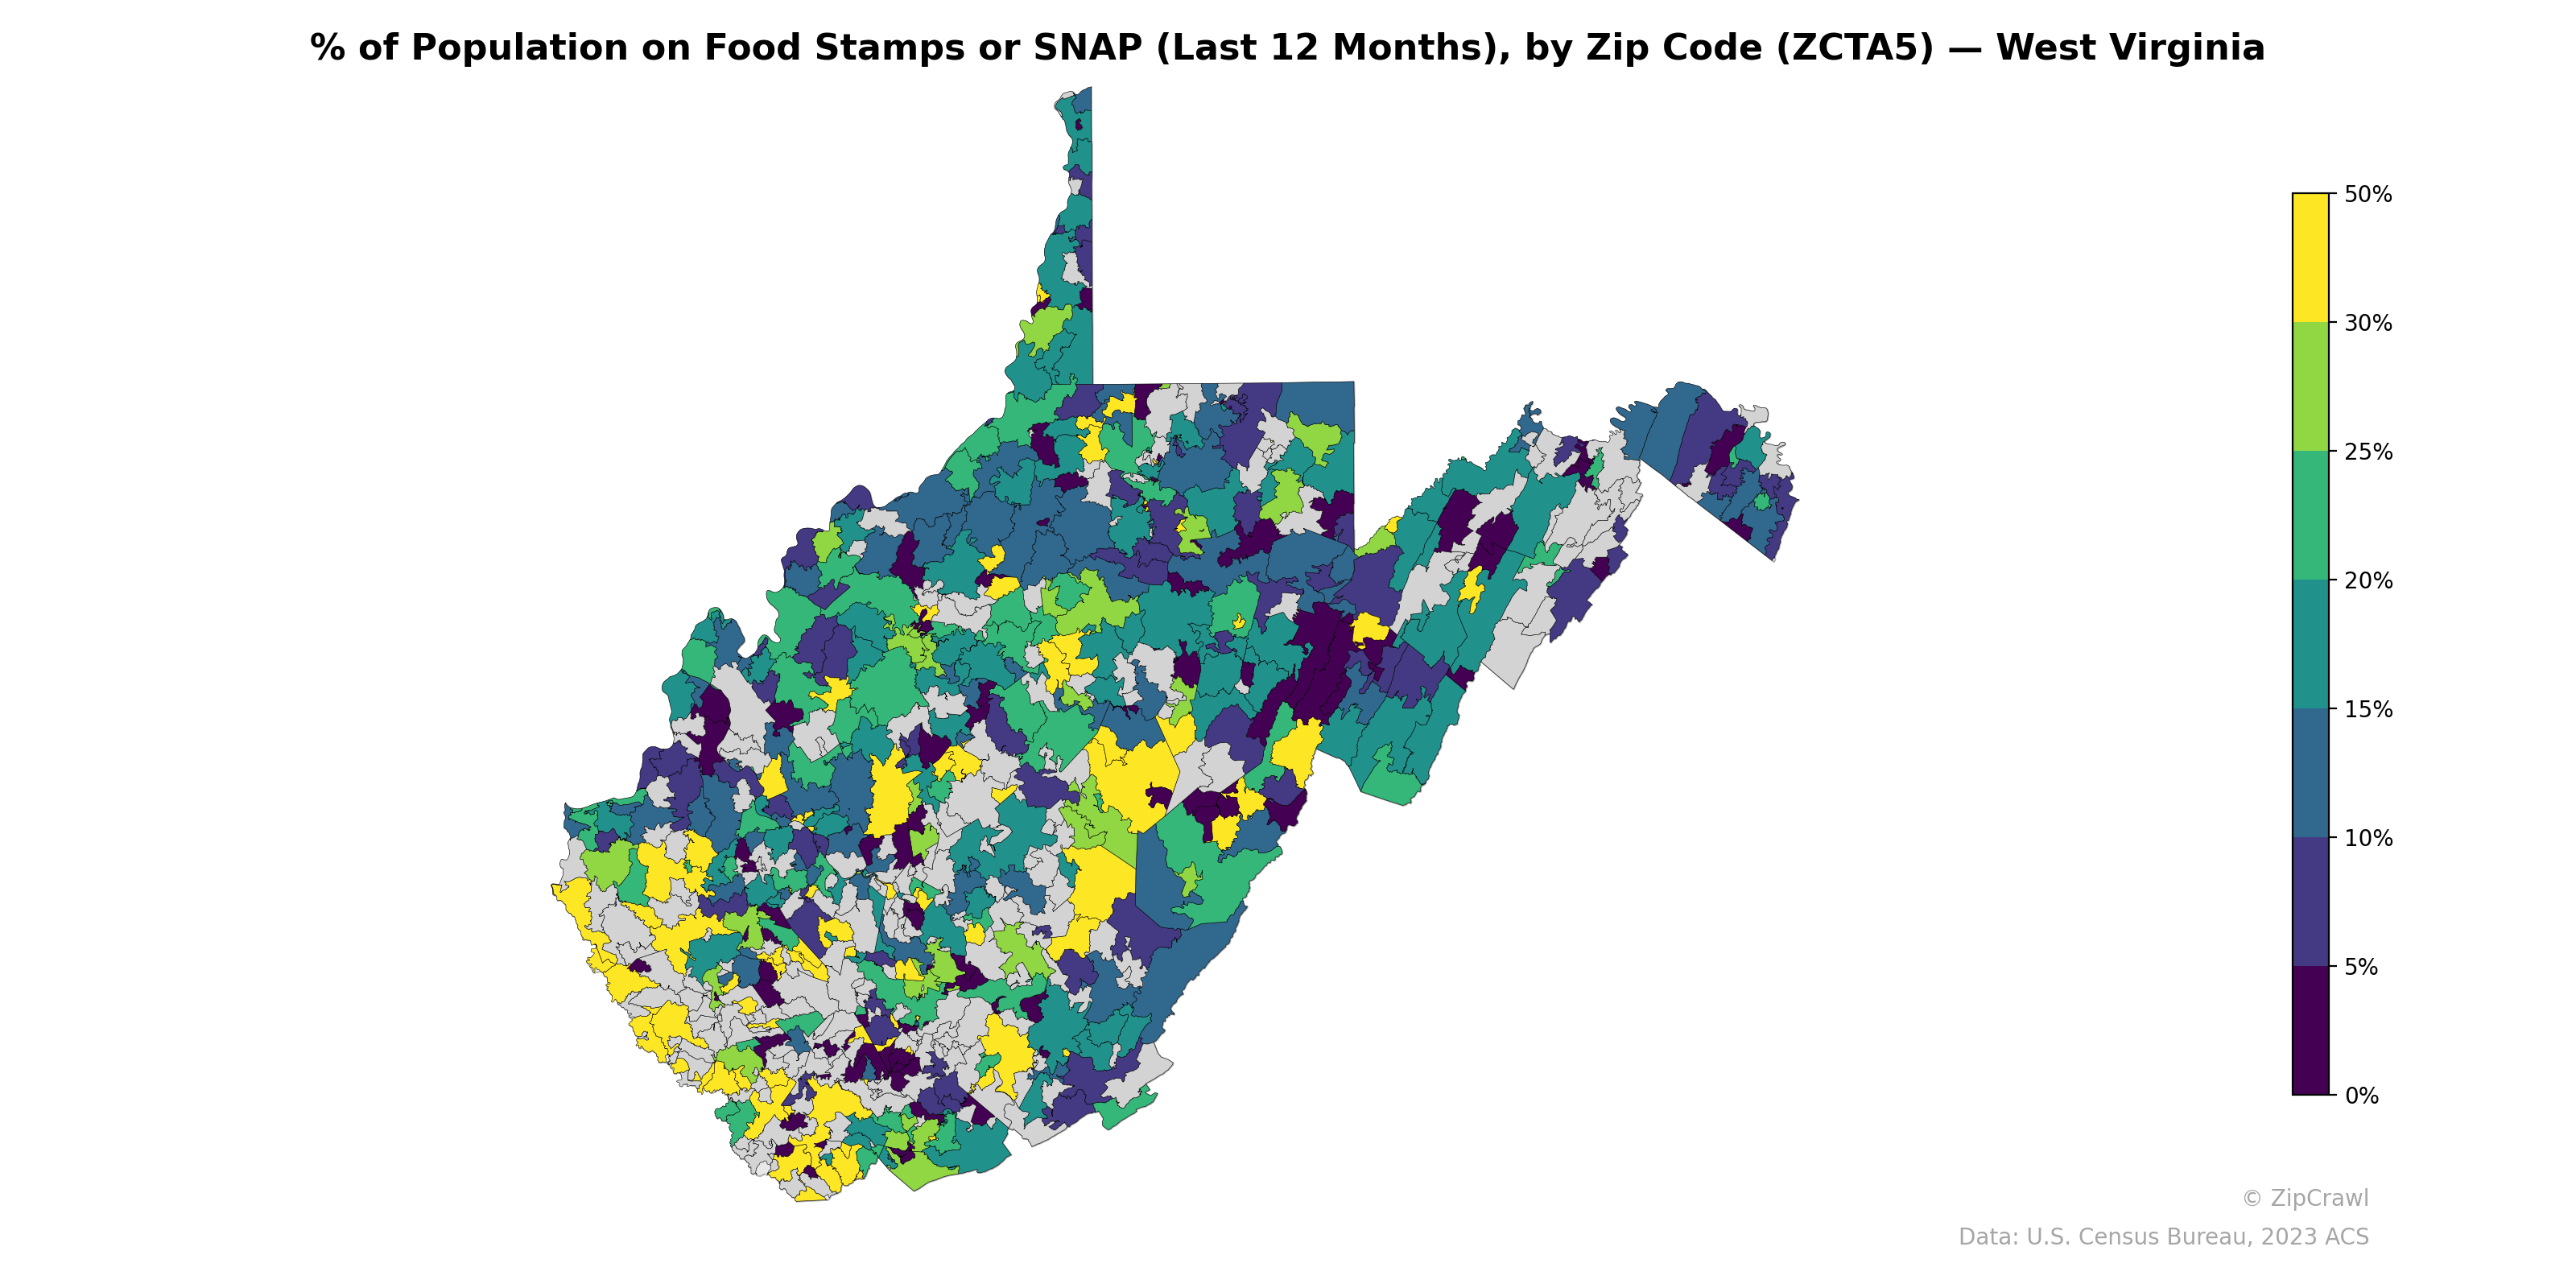
NOTE: Gray indicates insufficient data or a suppressed estimate.
Southern West Virginia's coalfield counties, particularly in the Mingo, McDowell, and Wyoming County areas, display consistently elevated SNAP participation rates often exceeding 30%, forming a distinct high-dependency cluster. In contrast, the Eastern Panhandle zip codes near the Virginia border and several areas in the north-central part of the state around Morgantown show notably lower rates, frequently below 10%, reflecting stronger economic conditions tied to federal employment corridors and university-driven economies. Scattered zip codes with very high rates (approaching 50%, shown in yellow) appear throughout the southern and central regions, likely corresponding to small, economically distressed communities interspersed among areas with moderate participation.
Data: U.S. Census Bureau, 2023 ACS
Explore
- Population Hispanic % by Zip Code (ZCTA5) — Hawaii
- Household Median Income by Zip Code (ZCTA5) — Hawaii
- Population Non-Hispanic Black % by Zip Code (ZCTA5) — Hawaii
- Married Couple (% of all Households) by Zip Code (ZCTA5) — West Virginia
- Population Non-Hispanic Asian % by Zip Code (ZCTA5) — West Virginia
- Housing Vacancy Rate by Zip Code (ZCTA5) — West Virginia
- Median Age by Zip Code (ZCTA5) — Hawaii
- Population Non-Hispanic White % by Zip Code (ZCTA5) — Hawaii
- U.S. Citizens (% of Population Over 18) by Zip Code (ZCTA5) — Hawaii
- Housing Median Monthly Rent ($), by County
- U.S. Citizens by County (% of Population Over 18)
- Housing Owner-Occupied % of Units, by Zip Code (ZCTA5) — Philadelphia Metro
- High School Graduate (% of Over 25) by Zip Code (ZCTA5) — New York
- Population Non-Hispanic White % by Zip Code (ZCTA5) — New York
- Household Median Income by Zip Code (ZCTA5) — New York
- Population Non-Hispanic Black % by Zip Code (ZCTA5) — New York
- Population Hispanic % by Zip Code (ZCTA5) — New York
- Population Non-Hispanic Asian % by Zip Code (ZCTA5) — Florida
- Population Non-Hispanic American Indian % by Zip Code (ZCTA5) — New York
- U.S. Citizens (% of Population Over 18) by Zip Code (ZCTA5) — New York
- Housing Owner-Occupied % of Units, by Zip Code (ZCTA5) — California
- Median Age by Zip Code (ZCTA5) — New York
- % of Population without Health Insurance, by Zip Code (ZCTA5) — West Virginia
- Bachelor's Degree or Higher (% of Over 25) by Zip Code (ZCTA5) — West Virginia
- % of Households with Broadband Internet, by Zip Code (ZCTA5) — West Virginia
- Population Non-Hispanic American Indian % by Zip Code (ZCTA5) — West Virginia
- High School Graduate (% of Over 25) by Zip Code (ZCTA5) — West Virginia
- Housing Owner-Occupied % of Units, by Zip Code (ZCTA5) — West Virginia
- Housing % of Units Built Since 2010, by Zip Code (ZCTA5) — West Virginia
- Household Average Size by Zip Code (ZCTA5) — West Virginia
- % of Population on Food Stamps or SNAP (Last 12 Months), by Zip Code (ZCTA5) — Virginia
- % of Population on Food Stamps or SNAP (Last 12 Months), by Zip Code (ZCTA5) — Georgia
- % of Population on Food Stamps or SNAP (Last 12 Months), by Zip Code (ZCTA5) — Vermont
- % of Population on Food Stamps or SNAP (Last 12 Months), by Zip Code (ZCTA5) — Montana
- % of Population on Food Stamps or SNAP (Last 12 Months), by Zip Code (ZCTA5) — Oregon
- % of Population on Food Stamps or SNAP (Last 12 Months), by Zip Code (ZCTA5) — Ohio
- % of Population on Food Stamps or SNAP (Last 12 Months), by Zip Code (ZCTA5) — Utah
- % of Population on Food Stamps or SNAP (Last 12 Months), by Zip Code (ZCTA5) — Iowa
- % of Population on Food Stamps or SNAP (Last 12 Months), by Zip Code (ZCTA5) — Maine
- % of Population on Food Stamps or SNAP (Last 12 Months), by Zip Code (ZCTA5) — California