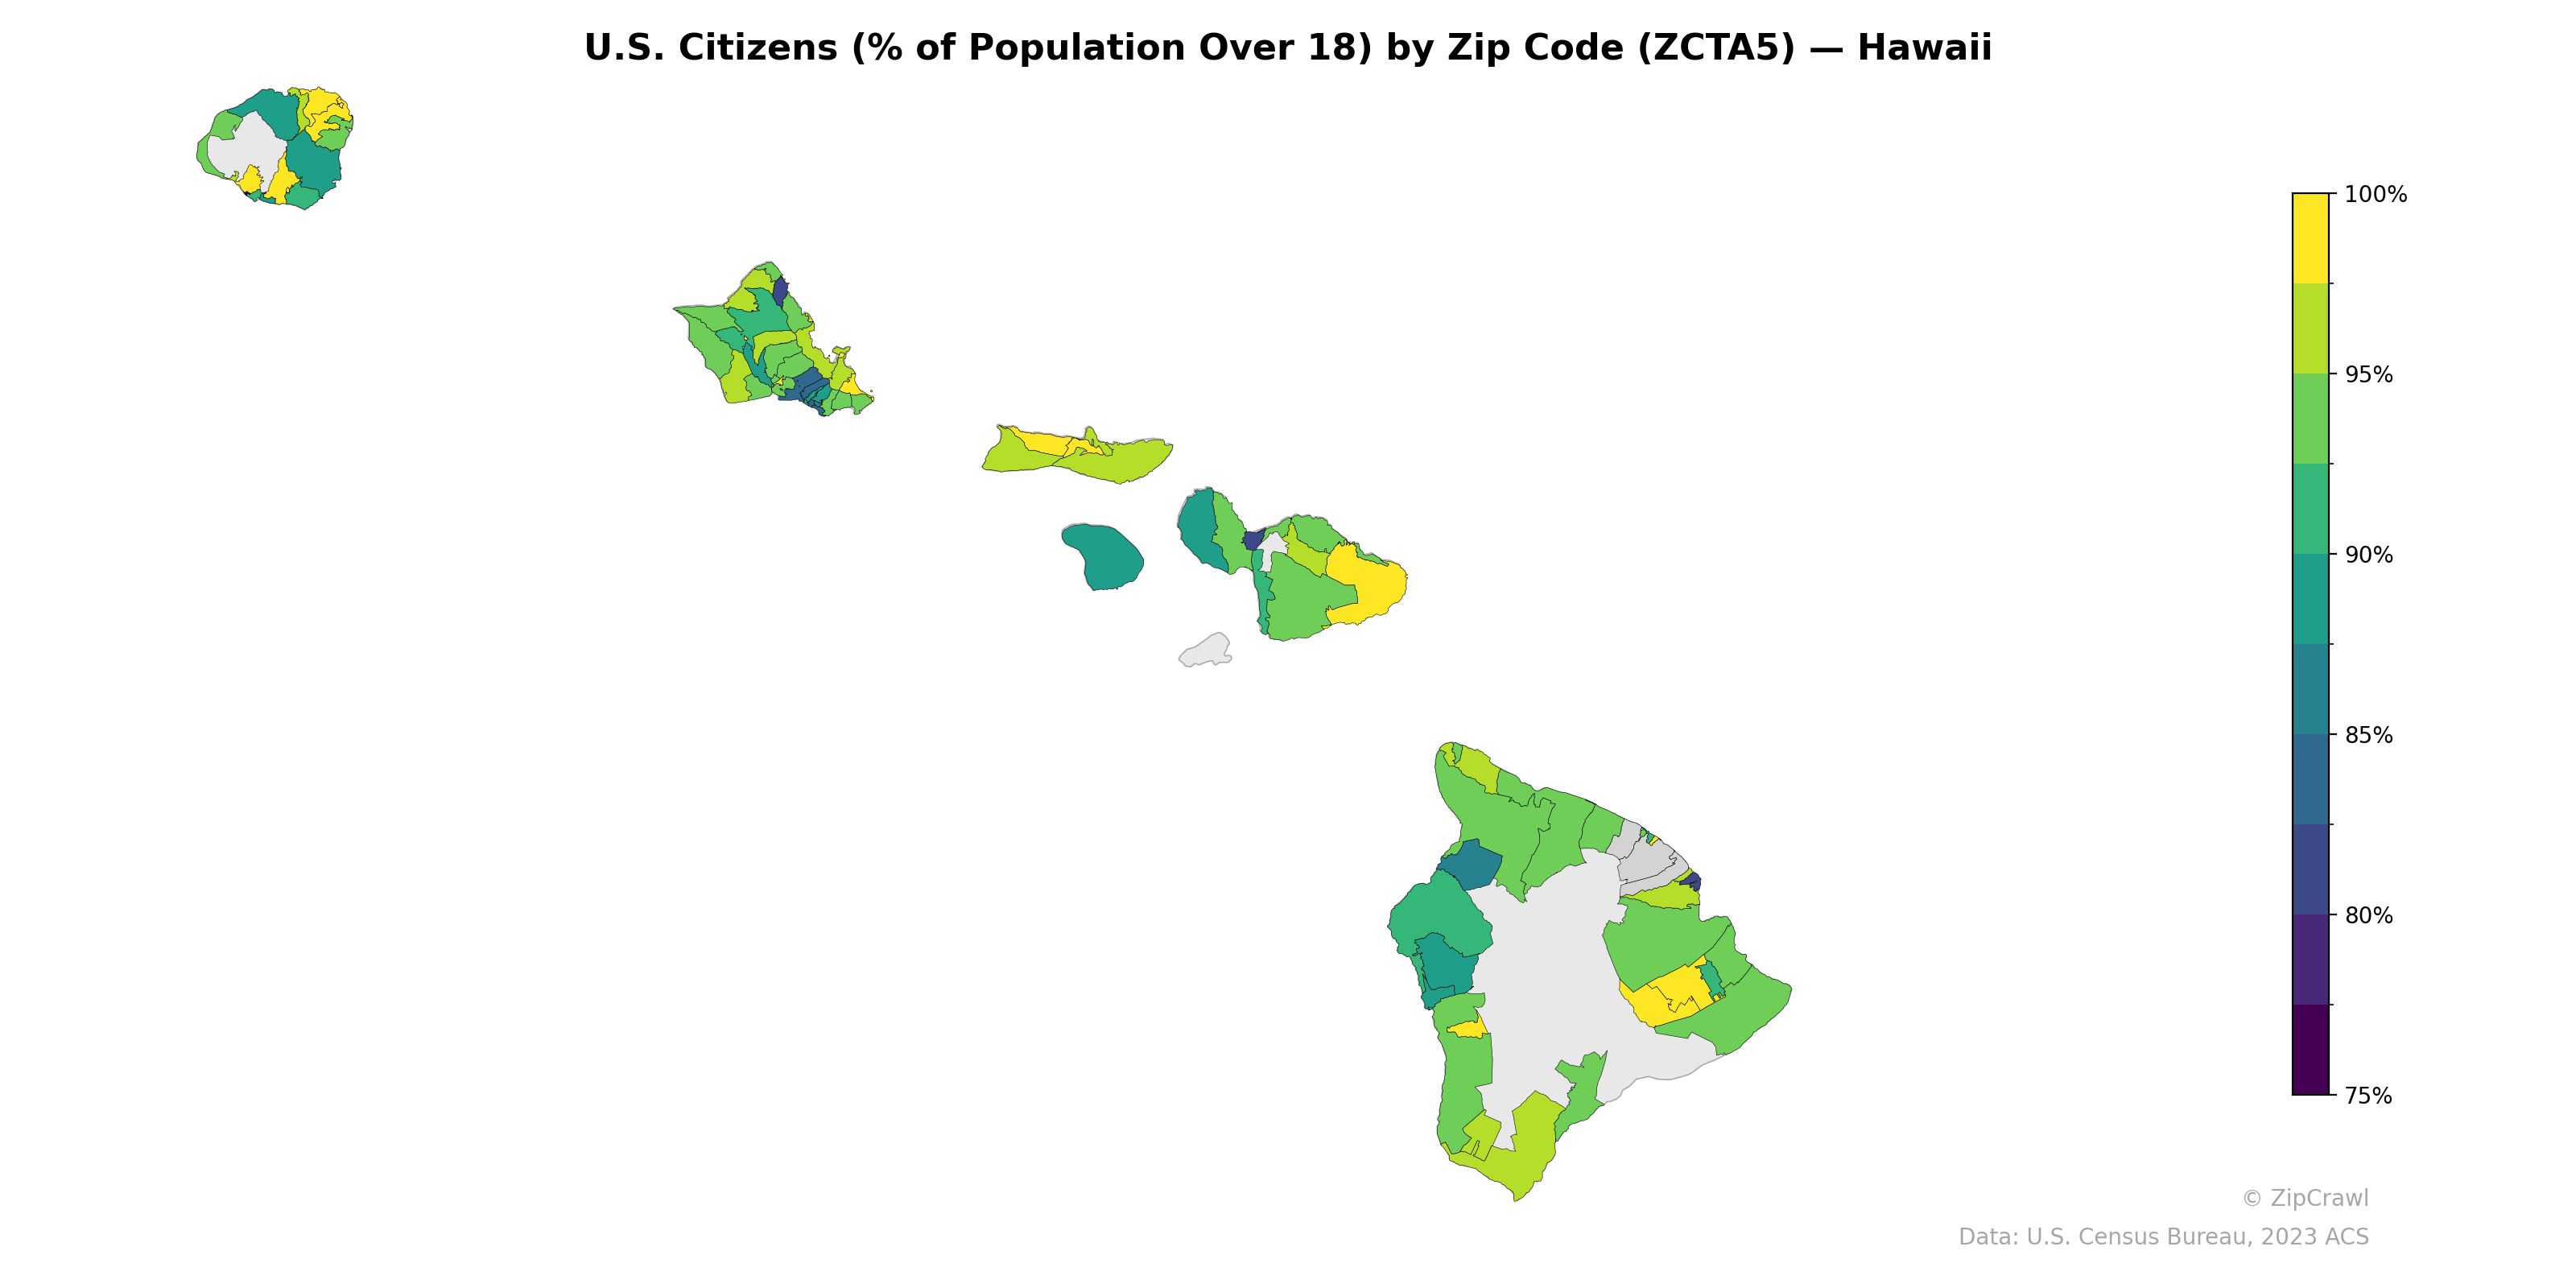
NOTE: Gray indicates insufficient data or a suppressed estimate.
Zip codes on the Big Island's Kona coast and portions of central Oahu display notably lower U.S. citizenship rates among adults, dropping to around 75–80%, likely reflecting concentrations of non-citizen workers in tourism and agricultural sectors. Rural areas across Kauai, Molokai, and the Big Island's southern districts generally report higher citizenship percentages, frequently exceeding 95%, consistent with longer-established resident populations. Maui exhibits a sharp internal contrast, with western resort-area zip codes showing markedly lower rates compared to the island's more residential eastern and upcountry communities.
Data: U.S. Census Bureau, 2023 ACS
Explore
- % of Population on Food Stamps or SNAP (Last 12 Months), by Zip Code (ZCTA5) — Florida
- Population Non-Hispanic Asian % by Zip Code (ZCTA5) — West Virginia
- Population Non-Hispanic White % by Zip Code (ZCTA5) — Hawaii
- Married Couple (% of all Households) by Zip Code (ZCTA5) — West Virginia
- Housing Vacancy Rate by Zip Code (ZCTA5) — West Virginia
- Population Non-Hispanic Black % by Zip Code (ZCTA5) — Hawaii
- Household Median Income by Zip Code (ZCTA5) — Hawaii
- % of Population on Food Stamps or SNAP (Last 12 Months), by Zip Code (ZCTA5) — West Virginia
- Median Age by Zip Code (ZCTA5) — Hawaii
- Population Hispanic % by Zip Code (ZCTA5) — Hawaii
- Housing Owner-Occupied Median Value ($), by Zip Code (ZCTA5) — California
- Housing Owner-Occupied Median Value ($), by Zip Code (ZCTA5) — Philadelphia Metro
- High School Graduate (% of Over 25) by Zip Code (ZCTA5) — New York
- Population Non-Hispanic White % by Zip Code (ZCTA5) — New York
- Median Age by Zip Code (ZCTA5) — New York
- Population Non-Hispanic Black % by Zip Code (ZCTA5) — New York
- Population Hispanic % by Zip Code (ZCTA5) — New York
- Population Non-Hispanic Asian % by Zip Code (ZCTA5) — Florida
- Population Non-Hispanic American Indian % by Zip Code (ZCTA5) — New York
- Household Median Income by Zip Code (ZCTA5) — New York
- % of Population without Health Insurance, by Zip Code (ZCTA5) — West Virginia
- Housing Owner-Occupied % of Units, by Zip Code (ZCTA5) — West Virginia
- Population Non-Hispanic American Indian % by Zip Code (ZCTA5) — West Virginia
- High School Graduate (% of Over 25) by Zip Code (ZCTA5) — West Virginia
- Bachelor's Degree or Higher (% of Over 25) by Zip Code (ZCTA5) — West Virginia
- Housing % of Units Built Since 2010, by Zip Code (ZCTA5) — West Virginia
- Household Average Size by Zip Code (ZCTA5) — West Virginia
- % of Households with Broadband Internet, by Zip Code (ZCTA5) — West Virginia
- Housing Owner-Occupied Median Value ($), by Zip Code (ZCTA5) — West Virginia
- Housing Median Monthly Rent ($), by Zip Code (ZCTA5) — West Virginia
- U.S. Citizens (% of Population Over 18) by Zip Code (ZCTA5) — Utah
- U.S. Citizens (% of Population Over 18) by Zip Code (ZCTA5) — Ohio
- U.S. Citizens (% of Population Over 18) by Zip Code (ZCTA5) — Oregon
- U.S. Citizens (% of Population Over 18) by Zip Code (ZCTA5) — Iowa
- U.S. Citizens (% of Population Over 18) by Zip Code (ZCTA5) — Texas
- U.S. Citizens (% of Population Over 18) by Zip Code (ZCTA5) — Idaho
- U.S. Citizens (% of Population Over 18) by Zip Code (ZCTA5) — Maine
- U.S. Citizens (% of Population Over 18) by Zip Code (ZCTA5) — Delaware
- U.S. Citizens (% of Population Over 18) by Zip Code (ZCTA5) — Colorado
- U.S. Citizens (% of Population Over 18) by Zip Code (ZCTA5) — Nevada