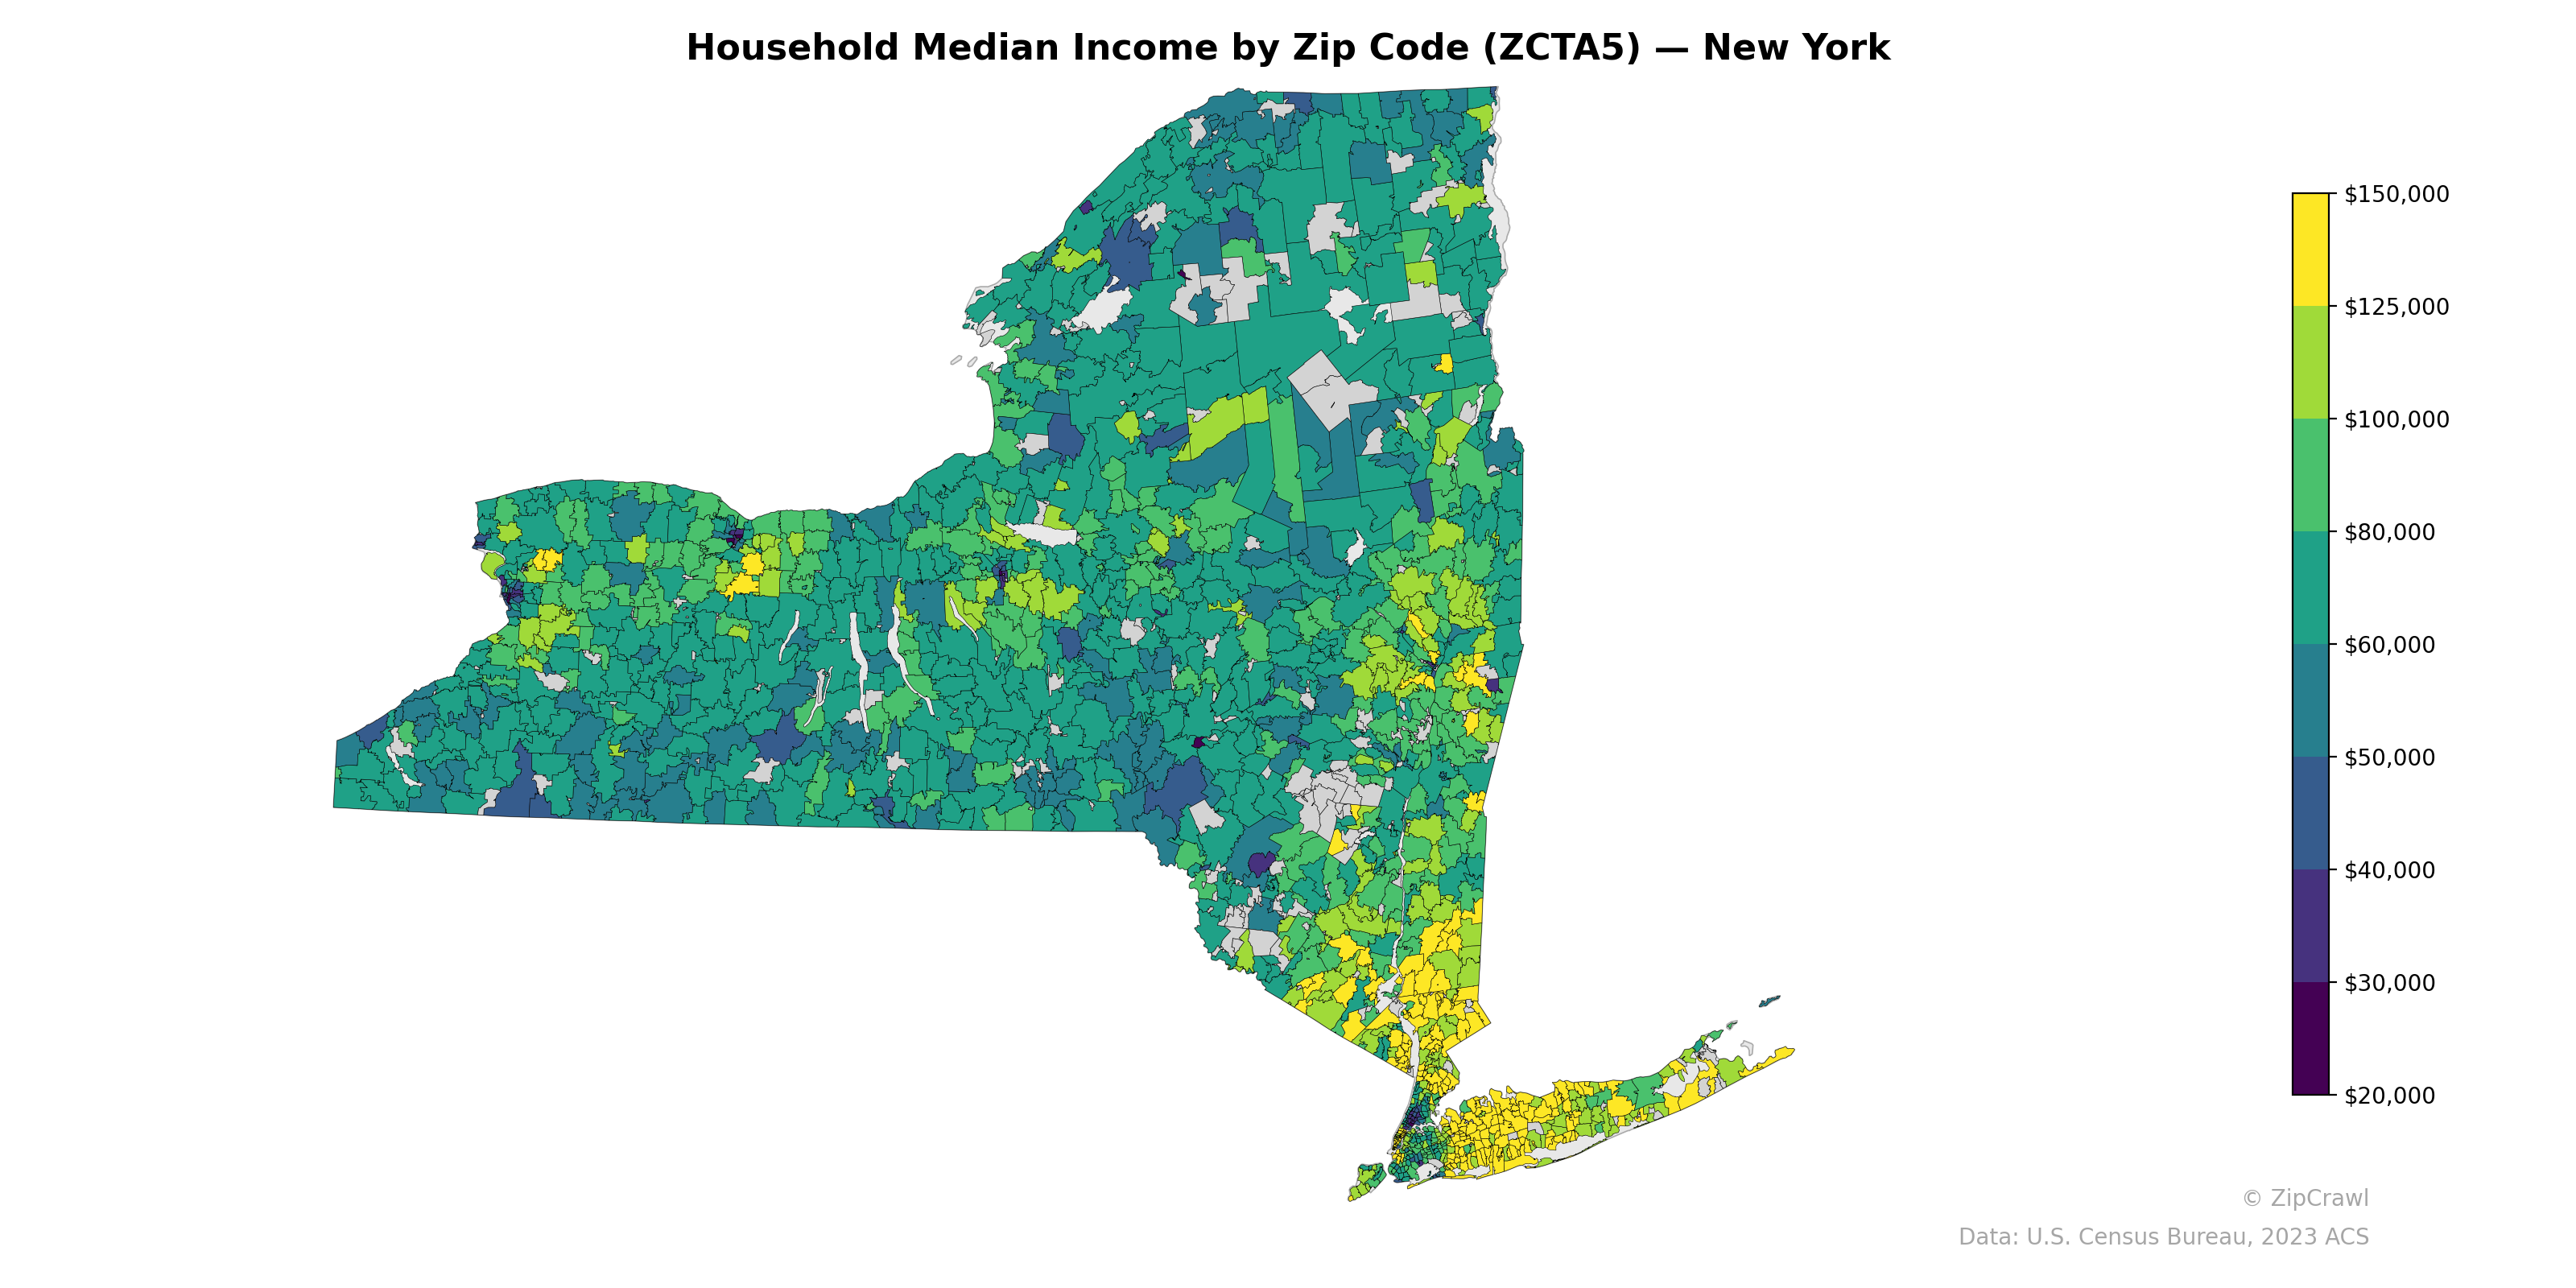
NOTE: Gray indicates insufficient data or a suppressed estimate.
The New York City suburban ring—particularly Westchester County, Nassau County, and western Suffolk County—displays the highest median household incomes in the state, with numerous zip codes exceeding $125,000, while parts of the Bronx and central Brooklyn register among the lowest at under $30,000, creating one of the sharpest income gradients in the country within a small geographic area. Upstate urban cores such as Syracuse, Rochester, Buffalo, and Albany appear as distinct low-income pockets (dark teal to blue) surrounded by moderate-income suburban and rural zip codes in the $50,000–$80,000 range. The Adirondack region and rural Southern Tier generally fall in the mid-range, though scattered zip codes with very low or suppressed income data (shown in gray) suggest small populations or data reliability limitations.
Data: U.S. Census Bureau, 2023 ACS
Explore
- Population Hispanic % by Zip Code (ZCTA5) — New Hampshire
- Population Non-Hispanic Black % by Zip Code (ZCTA5) — New Hampshire
- Housing Vacancy Rate by Zip Code (ZCTA5) — Hawaii
- Population Non-Hispanic White % by Zip Code (ZCTA5) — New Hampshire
- % of Households with Broadband Internet, by Zip Code (ZCTA5) — New Hampshire
- % of Population on Food Stamps or SNAP (Last 12 Months), by Zip Code (ZCTA5) — Hawaii
- U.S. Citizens (% of Population Over 18) by Zip Code (ZCTA5) — New Hampshire
- Married Couple (% of all Households) by Zip Code (ZCTA5) — Hawaii
- Median Age by Zip Code (ZCTA5) — New Hampshire
- Population Non-Hispanic Asian % by Zip Code (ZCTA5) — Hawaii
- U.S. Citizens by County (% of Population Over 18)
- Population Non-Hispanic White % by Zip Code (ZCTA5) — New York
- Population Non-Hispanic Black % by Zip Code (ZCTA5) — New York
- Median Age by Zip Code (ZCTA5) — New York
- Population Non-Hispanic American Indian % by Zip Code (ZCTA5) — New York
- Population Non-Hispanic Asian % by Zip Code (ZCTA5) — Florida
- % of Population on Food Stamps or SNAP (Last 12 Months), by Zip Code (ZCTA5) — Florida
- Population Hispanic % by Zip Code (ZCTA5) — New York
- High School Graduate (% of Over 25) by Zip Code (ZCTA5) — New York
- U.S. Citizens (% of Population Over 18) by Zip Code (ZCTA5) — New York
- Housing Vacancy Rate by Zip Code (ZCTA5) — West Virginia
- % of Population without Health Insurance, by Zip Code (ZCTA5) — West Virginia
- Population Non-Hispanic Asian % by Zip Code (ZCTA5) — West Virginia
- % of Households with Broadband Internet, by Zip Code (ZCTA5) — Iowa
- % of Households with Broadband Internet, by Zip Code (ZCTA5) — New Mexico
- Population Hispanic % by Zip Code (ZCTA5) — Hawaii
- Bachelor's Degree or Higher (% of Over 25) by Zip Code (ZCTA5) — West Virginia
- High School Graduate (% of Over 25) by Zip Code (ZCTA5) — West Virginia
- % of Households with Broadband Internet, by Zip Code (ZCTA5) — West Virginia
- % of Households with Broadband Internet, by Zip Code (ZCTA5) — Kentucky
- Household Median Income by Zip Code (ZCTA5) — New York Metro
- Household Median Income by Zip Code (ZCTA5) — New Mexico
- Household Median Income by Zip Code (ZCTA5) — New Jersey
- Household Median Income by Zip Code (ZCTA5) — Nevada
- Household Median Income by Zip Code (ZCTA5) — New Hampshire
- Household Median Income by Zip Code (ZCTA5) — Iowa
- Household Median Income by Zip Code (ZCTA5) — Indiana
- Household Median Income by Zip Code (ZCTA5) — Nebraska
- Household Median Income by Zip Code (ZCTA5) — Ohio
- Household Median Income by Zip Code (ZCTA5) — Utah