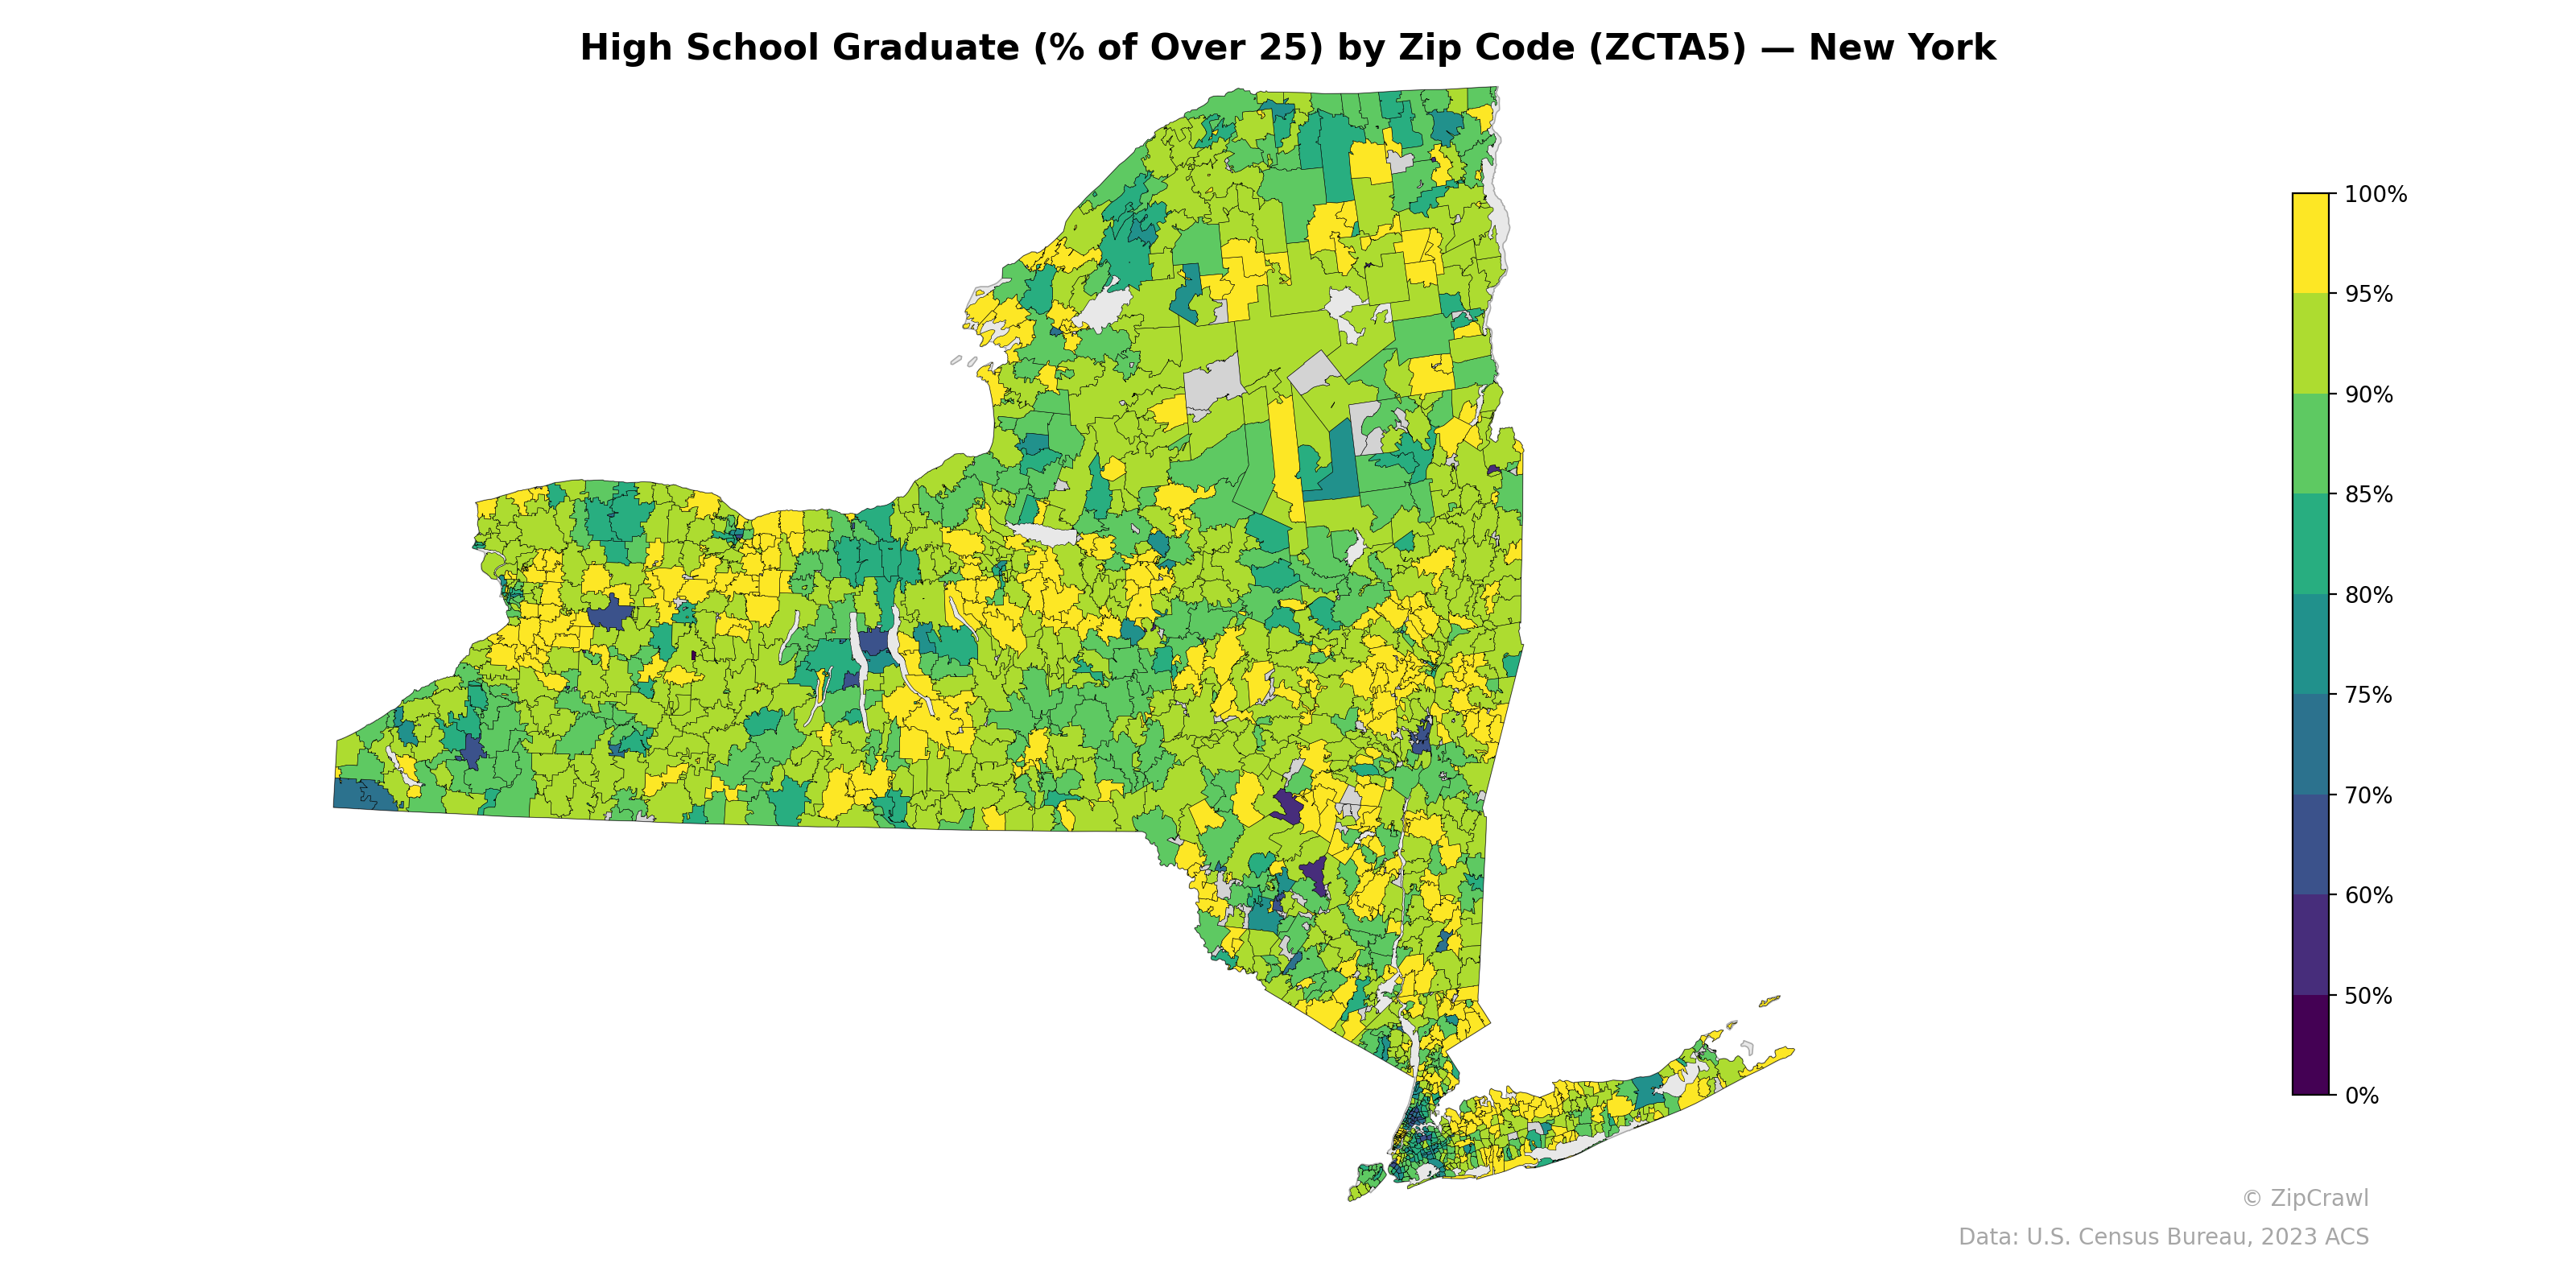
NOTE: Gray indicates insufficient data or a suppressed estimate.
High school graduation rates across New York State exhibit a clear urban-rural divide, with New York City—particularly parts of the Bronx and Brooklyn—displaying some of the lowest rates, dropping below 70%, while many suburban and rural zip codes in the Southern Tier, Finger Lakes, and Adirondack regions consistently exceed 90%. A notable cluster of lower attainment also appears around Syracuse, Rochester, and Buffalo, corresponding to urban cores with historically underserved populations. Long Island presents a sharp internal contrast, with affluent areas on the North Shore and Hamptons reaching near-universal graduation rates while pockets in western Suffolk and parts of Nassau fall noticeably behind.
Data: U.S. Census Bureau, 2023 ACS
Explore
- Household Average Size by Zip Code (ZCTA5) — New Hampshire
- Median Age by Zip Code (ZCTA5) — Rhode Island
- U.S. Citizens (% of Population Over 18) by Zip Code (ZCTA5) — Rhode Island
- Population Non-Hispanic Asian % by Zip Code (ZCTA5) — Montana
- Population Non-Hispanic Black % by Zip Code (ZCTA5) — Rhode Island
- Population Non-Hispanic White % by Zip Code (ZCTA5) — Rhode Island
- Household Median Income by Zip Code (ZCTA5) — Rhode Island
- % of Population on Food Stamps or SNAP (Last 12 Months), by Zip Code (ZCTA5) — Montana
- Married Couple (% of all Households) by Zip Code (ZCTA5) — Montana
- Housing Vacancy Rate by Zip Code (ZCTA5) — Montana
- Population Hispanic % by Zip Code (ZCTA5) — Rhode Island
- U.S. Citizens by County (% of Population Over 18)
- Population Non-Hispanic American Indian % by Zip Code (ZCTA5) — New York
- Household Median Income by Zip Code (ZCTA5) — New York
- Median Age by Zip Code (ZCTA5) — New York
- U.S. Citizens (% of Population Over 18) by Zip Code (ZCTA5) — New York
- Population Non-Hispanic White % by Zip Code (ZCTA5) — New York
- Population Hispanic % by Zip Code (ZCTA5) — New York
- Population Non-Hispanic Asian % by Zip Code (ZCTA5) — Florida
- % of Population on Food Stamps or SNAP (Last 12 Months), by Zip Code (ZCTA5) — Florida
- Population Non-Hispanic Black % by Zip Code (ZCTA5) — New York
- Housing Vacancy Rate by Zip Code (ZCTA5) — West Virginia
- % of Population without Health Insurance, by Zip Code (ZCTA5) — West Virginia
- Population Non-Hispanic Asian % by Zip Code (ZCTA5) — West Virginia
- Household Average Size by Zip Code (ZCTA5) — Kentucky
- Household Average Size by Zip Code (ZCTA5) — Iowa
- Bachelor's Degree or Higher (% of Over 25) by Zip Code (ZCTA5) — West Virginia
- Population Non-Hispanic American Indian % by Zip Code (ZCTA5) — West Virginia
- % of Households with Broadband Internet, by Zip Code (ZCTA5) — West Virginia
- Population Hispanic % by Zip Code (ZCTA5) — Hawaii
- High School Graduate (% of Over 25) by Zip Code (ZCTA5) — New York Metro
- High School Graduate (% of Over 25) by Zip Code (ZCTA5) — New Jersey
- High School Graduate (% of Over 25) by Zip Code (ZCTA5) — New Mexico
- High School Graduate (% of Over 25) by Zip Code (ZCTA5) — Nevada
- High School Graduate (% of Over 25) by Zip Code (ZCTA5) — New Hampshire
- High School Graduate (% of Over 25) by Zip Code (ZCTA5) — Ohio
- High School Graduate (% of Over 25) by Zip Code (ZCTA5) — Nebraska
- High School Graduate (% of Over 25) by Zip Code (ZCTA5) — Iowa
- High School Graduate (% of Over 25) by Zip Code (ZCTA5) — Utah
- High School Graduate (% of Over 25) by Zip Code (ZCTA5) — Colorado