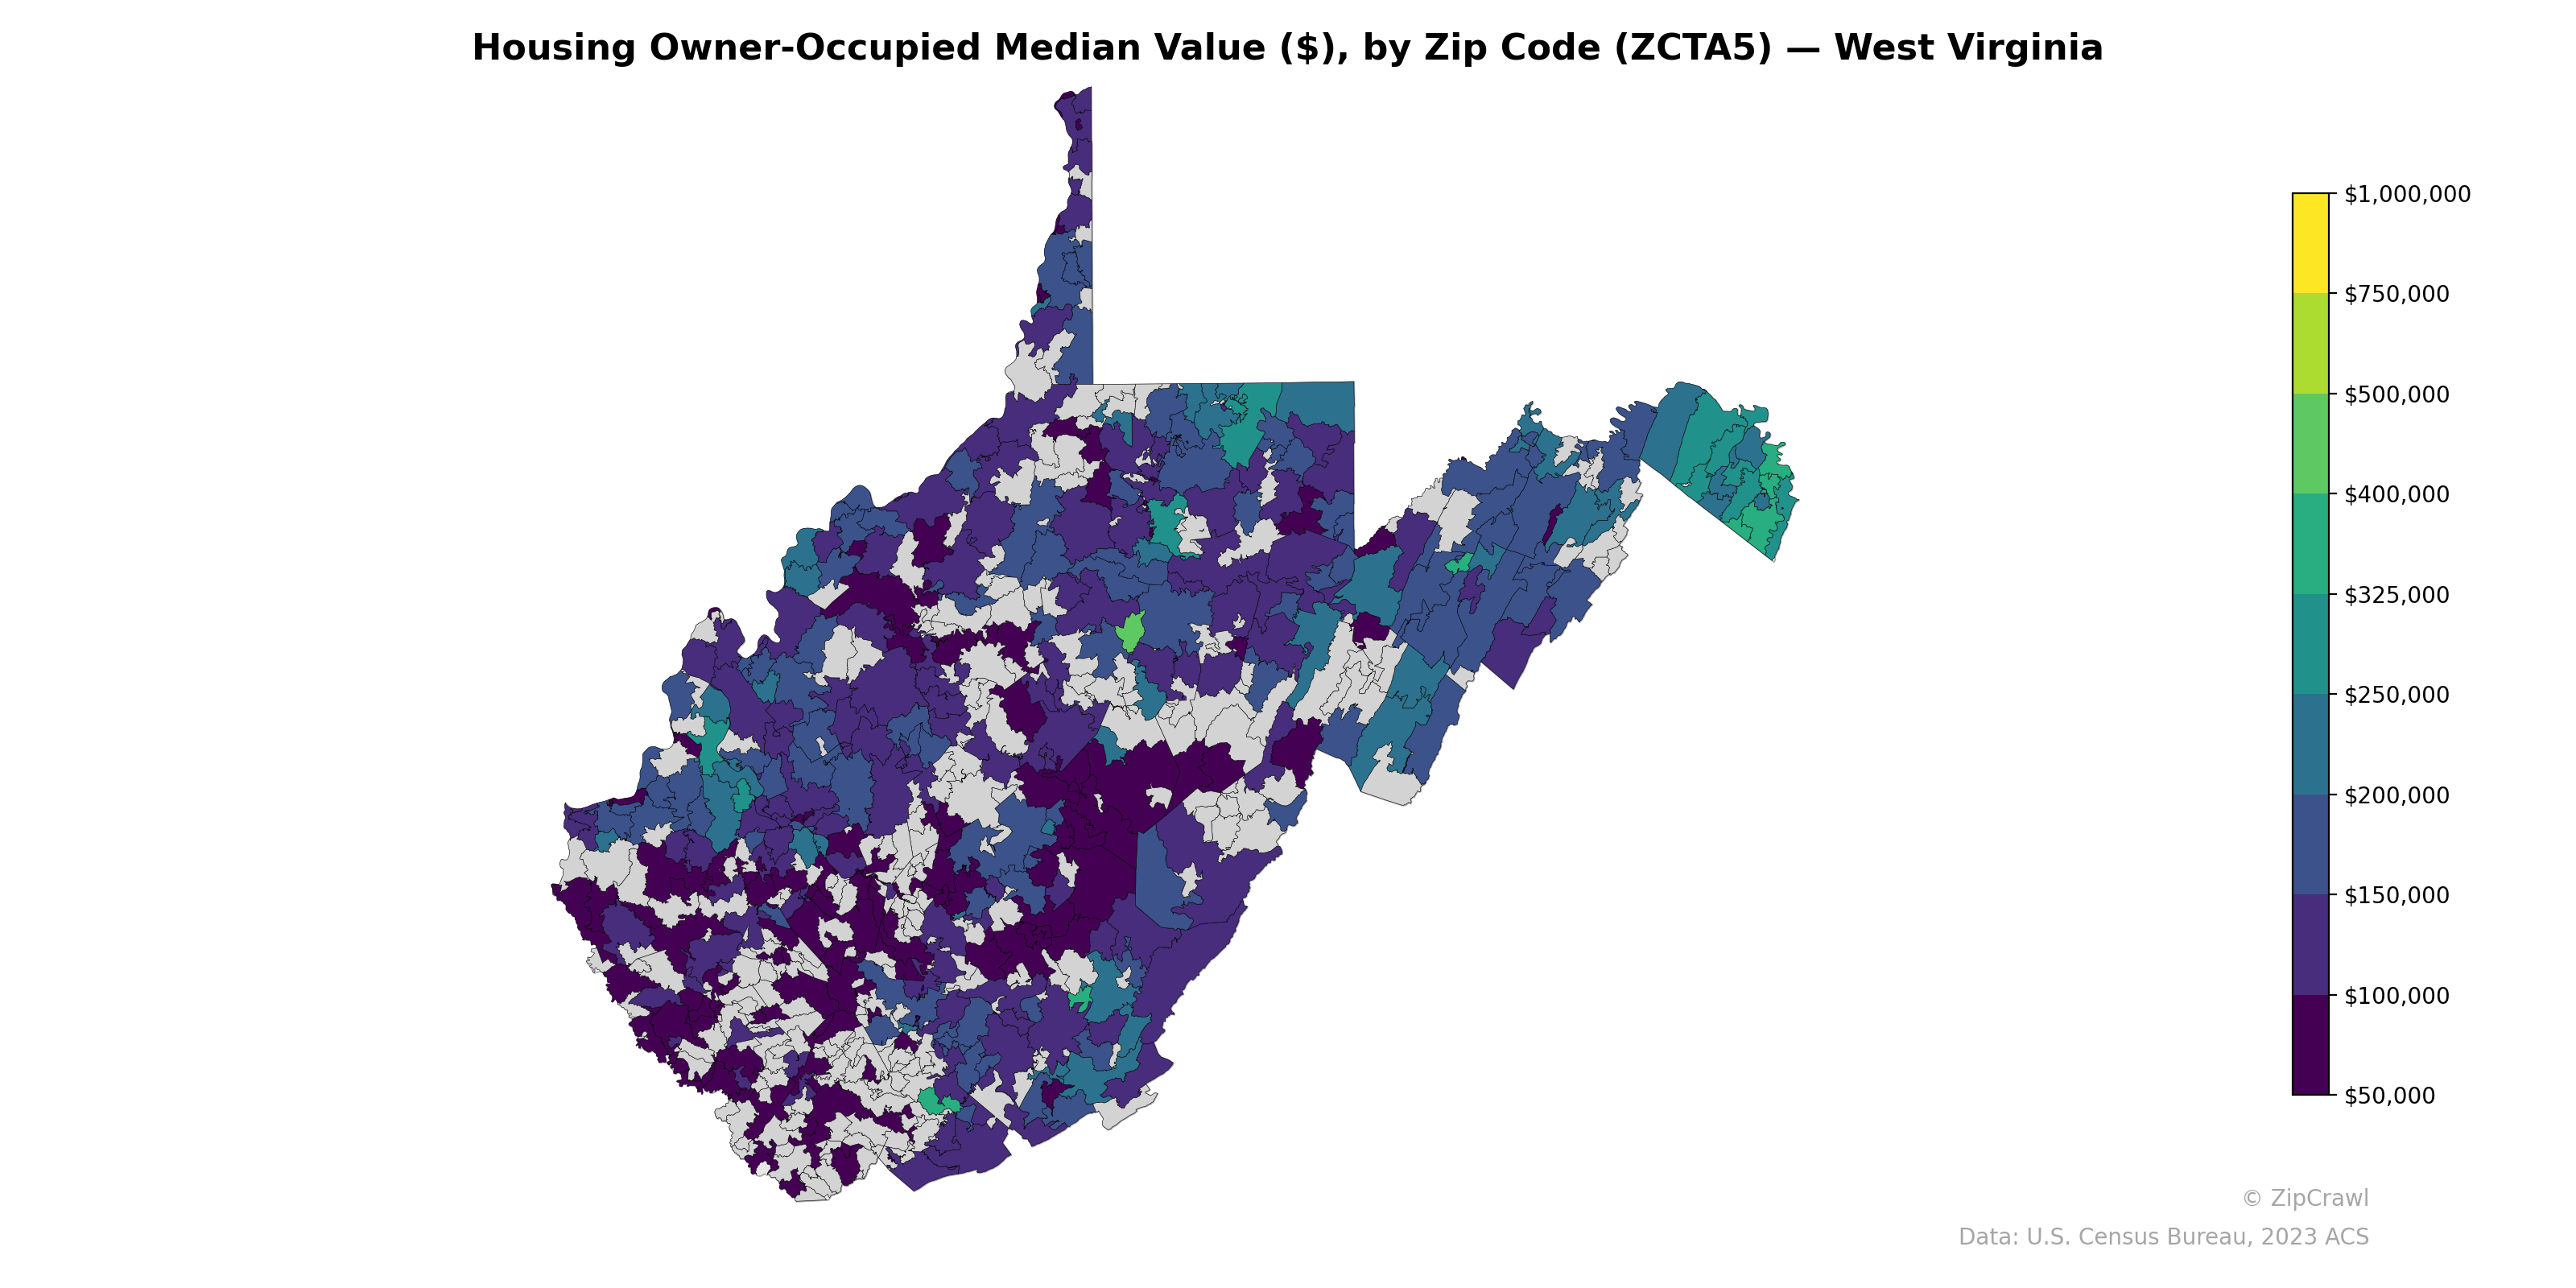
NOTE: Gray indicates insufficient data or a suppressed estimate.
The Eastern Panhandle—particularly zip codes near Martinsburg, Charles Town, and the commuter corridor to the Washington, D.C. metro area—displays the highest median home values in the state, with several ZCTAs exceeding $250,000 and approaching $400,000, while a small cluster near Morgantown in the north-central region also trends notably higher than surrounding areas. In sharp contrast, the southern coalfield counties spanning from McDowell through Mingo and Wyoming counties form a persistent band of deeply suppressed home values, frequently falling below $50,000–$75,000. The central highlands around Pocahontas and Greenbrier counties show moderate values likely influenced by resort and recreational economies, creating a visible transition zone between the low-value southern interior and the higher-value eastern border regions.
Data: U.S. Census Bureau, 2023 ACS
Explore
- Population Non-Hispanic Asian % by Zip Code (ZCTA5) — Florida
- Housing Owner-Occupied % of Units, by Zip Code (ZCTA5) — West Virginia
- High School Graduate (% of Over 25) by Zip Code (ZCTA5) — West Virginia
- Bachelor's Degree or Higher (% of Over 25) by Zip Code (ZCTA5) — West Virginia
- % of Population without Health Insurance, by Zip Code (ZCTA5) — West Virginia
- Population Non-Hispanic American Indian % by Zip Code (ZCTA5) — West Virginia
- Household Average Size by Zip Code (ZCTA5) — West Virginia
- Housing % of Units Built Since 2010, by Zip Code (ZCTA5) — West Virginia
- Housing Median Monthly Rent ($), by Zip Code (ZCTA5) — West Virginia
- % of Households with Broadband Internet, by Zip Code (ZCTA5) — West Virginia
- U.S. Citizens by County (% of Population Over 18)
- Population Hispanic % by Zip Code (ZCTA5) — Philadelphia Metro
- Population Non-Hispanic American Indian % by Zip Code (ZCTA5) — New York
- High School Graduate (% of Over 25) by Zip Code (ZCTA5) — New York
- Median Age by Zip Code (ZCTA5) — New York
- U.S. Citizens (% of Population Over 18) by Zip Code (ZCTA5) — New York
- Population Non-Hispanic White % by Zip Code (ZCTA5) — New York
- Population Hispanic % by Zip Code (ZCTA5) — California
- Population Hispanic % by Zip Code (ZCTA5) — New York
- % of Population on Food Stamps or SNAP (Last 12 Months), by Zip Code (ZCTA5) — Florida
- Population Non-Hispanic Black % by Zip Code (ZCTA5) — New York
- Household Median Income by Zip Code (ZCTA5) — New York
- Housing Vacancy Rate by Zip Code (ZCTA5) — West Virginia
- Population Non-Hispanic Asian % by Zip Code (ZCTA5) — West Virginia
- Population Hispanic % by Zip Code (ZCTA5) — Hawaii
- % of Population on Food Stamps or SNAP (Last 12 Months), by Zip Code (ZCTA5) — West Virginia
- Population Non-Hispanic Black % by Zip Code (ZCTA5) — Hawaii
- Married Couple (% of all Households) by Zip Code (ZCTA5) — West Virginia
- U.S. Citizens (% of Population Over 18) by Zip Code (ZCTA5) — Hawaii
- Household Median Income by Zip Code (ZCTA5) — Hawaii
- Housing Owner-Occupied Median Value ($), by Zip Code (ZCTA5) — Virginia
- Housing Owner-Occupied Median Value ($), by Zip Code (ZCTA5) — Georgia
- Housing Owner-Occupied Median Value ($), by Zip Code (ZCTA5) — Wyoming
- Housing Owner-Occupied Median Value ($), by Zip Code (ZCTA5) — Ohio
- Housing Owner-Occupied Median Value ($), by Zip Code (ZCTA5) — Utah
- Housing Owner-Occupied Median Value ($), by Zip Code (ZCTA5) — Maine
- Housing Owner-Occupied Median Value ($), by Zip Code (ZCTA5) — Iowa
- Housing Owner-Occupied Median Value ($), by Zip Code (ZCTA5) — California
- Housing Owner-Occupied Median Value ($), by Zip Code (ZCTA5) — Indiana
- Housing Owner-Occupied Median Value ($), by Zip Code (ZCTA5) — Oregon