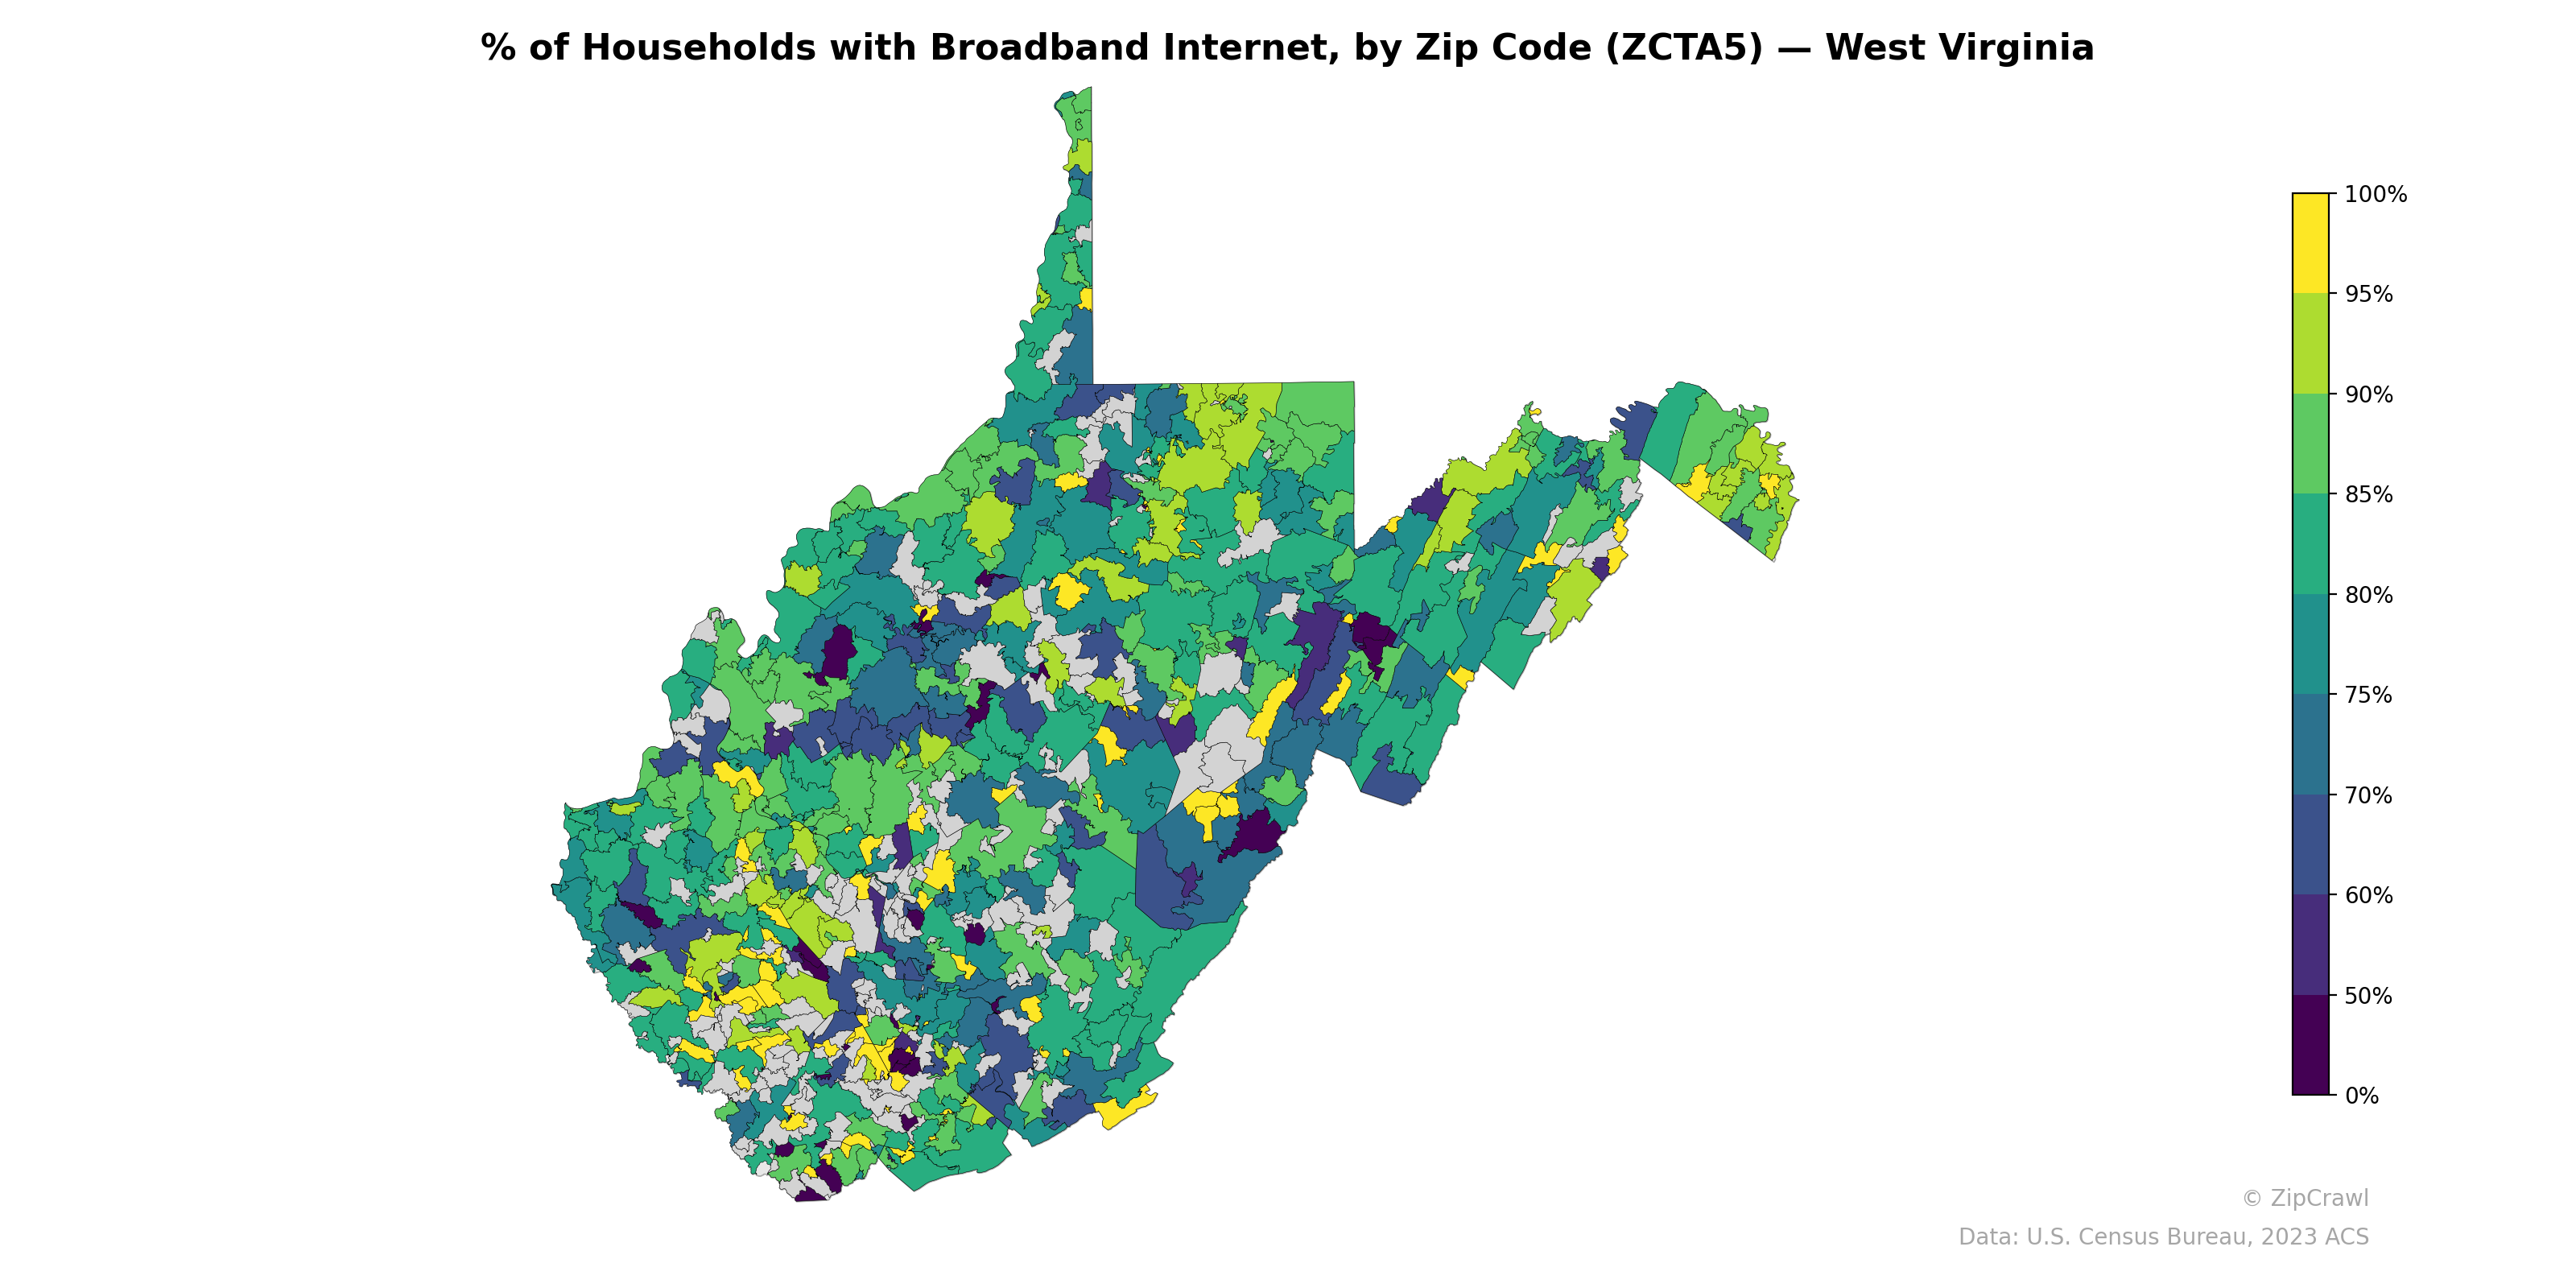
NOTE: Gray indicates insufficient data or a suppressed estimate.
Broadband adoption rates across West Virginia exhibit a pronounced north-south gradient, with zip codes in the Eastern Panhandle and northern tier consistently reaching 85–95%+ coverage, while clusters in the southern coalfield counties—particularly in Mingo, McDowell, and Wyoming counties—drop below 50–60%. The central mountainous region displays significant fragmentation, with pockets of high connectivity near population centers like Charleston and Morgantown surrounded by adjacent rural zip codes lagging 20–30 percentage points behind. Gray-shaded areas with missing data concentrate in sparsely populated zones, likely reflecting zip codes with insufficient sample sizes in the ACS estimates.
Data: U.S. Census Bureau, 2023 ACS
Explore
- Population Non-Hispanic Asian % by Zip Code (ZCTA5) — Florida
- Bachelor's Degree or Higher (% of Over 25) by Zip Code (ZCTA5) — West Virginia
- High School Graduate (% of Over 25) by Zip Code (ZCTA5) — West Virginia
- % of Population without Health Insurance, by Zip Code (ZCTA5) — West Virginia
- Housing Owner-Occupied % of Units, by Zip Code (ZCTA5) — West Virginia
- Population Non-Hispanic American Indian % by Zip Code (ZCTA5) — West Virginia
- Household Average Size by Zip Code (ZCTA5) — West Virginia
- Housing % of Units Built Since 2010, by Zip Code (ZCTA5) — West Virginia
- Housing Owner-Occupied Median Value ($), by Zip Code (ZCTA5) — West Virginia
- Housing Median Monthly Rent ($), by Zip Code (ZCTA5) — West Virginia
- U.S. Citizens by County (% of Population Over 18)
- Household Median Income by Zip Code (ZCTA5) — Philadelphia Metro
- Population Non-Hispanic American Indian % by Zip Code (ZCTA5) — New York
- High School Graduate (% of Over 25) by Zip Code (ZCTA5) — New York
- Median Age by Zip Code (ZCTA5) — New York
- Household Median Income by Zip Code (ZCTA5) — New York
- Population Non-Hispanic White % by Zip Code (ZCTA5) — New York
- Population Hispanic % by Zip Code (ZCTA5) — New York
- % of Population on Food Stamps or SNAP (Last 12 Months), by Zip Code (ZCTA5) — Florida
- U.S. Citizens (% of Population Over 18) by Zip Code (ZCTA5) — New York
- Population Non-Hispanic Black % by Zip Code (ZCTA5) — New York
- Household Median Income by Zip Code (ZCTA5) — California
- Housing Vacancy Rate by Zip Code (ZCTA5) — West Virginia
- Population Non-Hispanic Asian % by Zip Code (ZCTA5) — West Virginia
- Population Hispanic % by Zip Code (ZCTA5) — Hawaii
- Population Non-Hispanic Black % by Zip Code (ZCTA5) — Hawaii
- % of Population on Food Stamps or SNAP (Last 12 Months), by Zip Code (ZCTA5) — West Virginia
- Married Couple (% of all Households) by Zip Code (ZCTA5) — West Virginia
- U.S. Citizens (% of Population Over 18) by Zip Code (ZCTA5) — Hawaii
- Household Median Income by Zip Code (ZCTA5) — Hawaii
- % of Households with Broadband Internet, by Zip Code (ZCTA5) — Virginia
- % of Households with Broadband Internet, by Zip Code (ZCTA5) — Georgia
- % of Households with Broadband Internet, by Zip Code (ZCTA5) — Iowa
- % of Households with Broadband Internet, by Zip Code (ZCTA5) — Ohio
- % of Households with Broadband Internet, by Zip Code (ZCTA5) — Utah
- % of Households with Broadband Internet, by Zip Code (ZCTA5) — Idaho
- % of Households with Broadband Internet, by Zip Code (ZCTA5) — California
- % of Households with Broadband Internet, by Zip Code (ZCTA5) — Vermont
- % of Households with Broadband Internet, by Zip Code (ZCTA5) — Oregon
- % of Households with Broadband Internet, by Zip Code (ZCTA5) — Texas