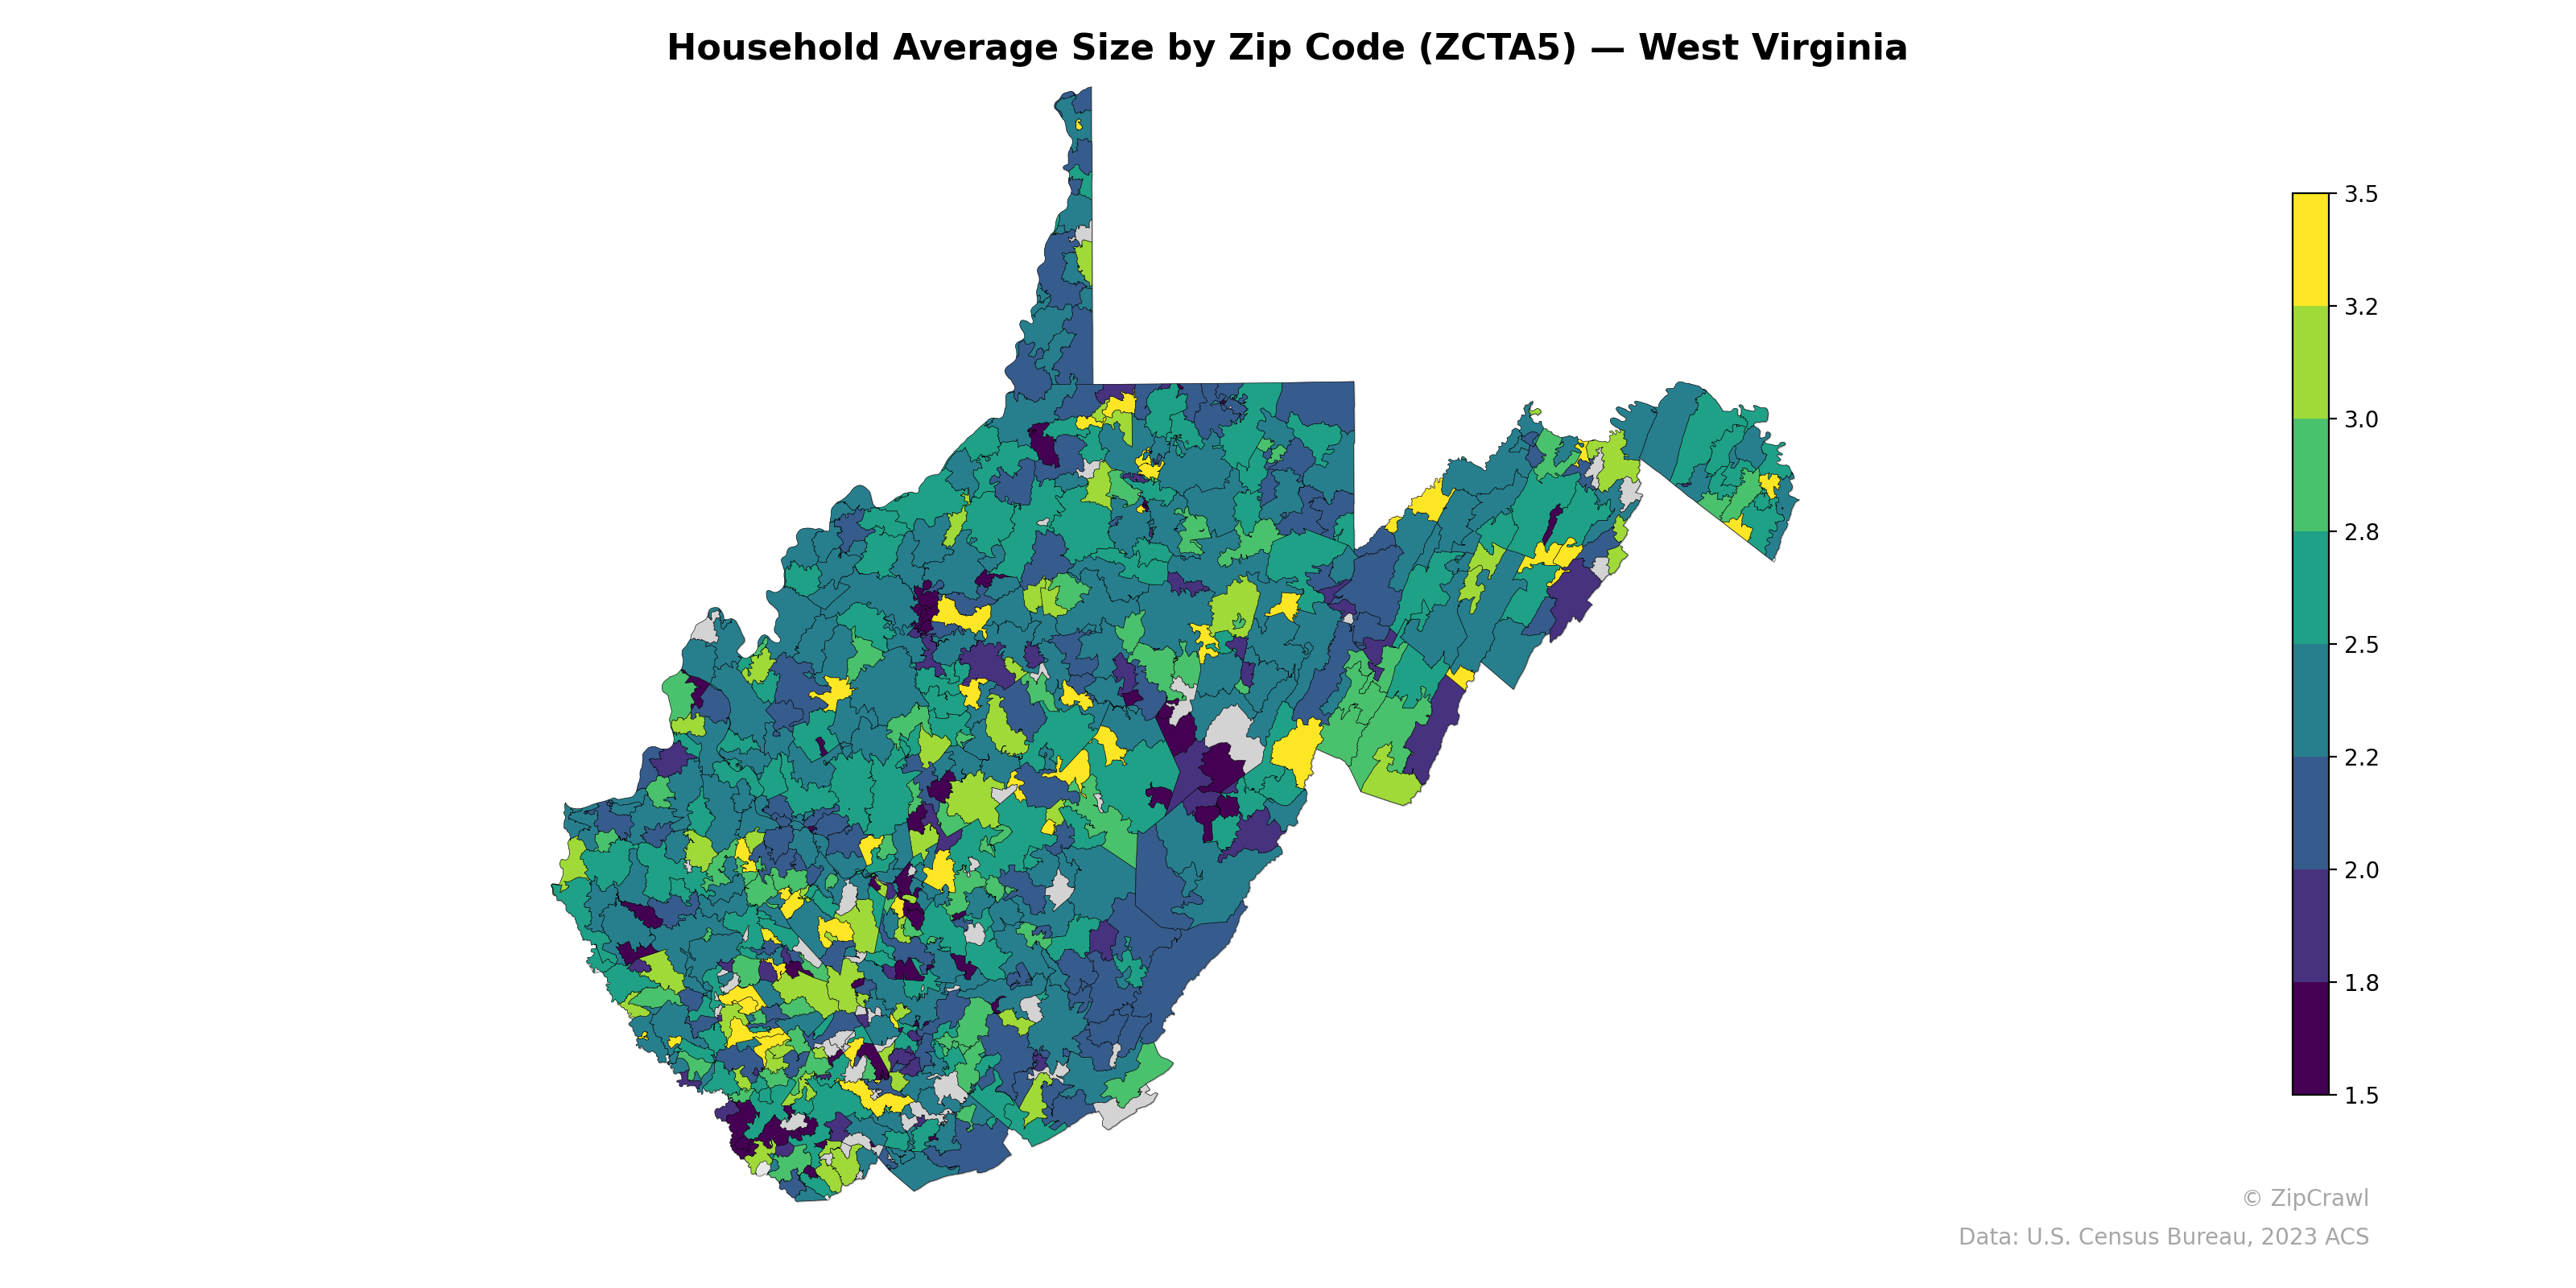
NOTE: Gray indicates insufficient data or a suppressed estimate.
Household sizes across West Virginia cluster most noticeably in the southern coalfield counties, where several zip codes fall below 2.0 persons per household, likely reflecting aging populations and outmigration in areas like McDowell and Mingo counties. The Eastern Panhandle near the Virginia border and scattered rural zip codes in the north-central region display notably higher averages approaching 3.0–3.5, consistent with younger family-oriented communities and exurban growth corridors. The contrast between the low-density purple pockets in college towns and mining communities versus the yellow-green zones in agricultural and suburban areas underscores significant demographic variation even within a relatively small state.
Data: U.S. Census Bureau, 2023 ACS
Explore
- Population Non-Hispanic Asian % by Zip Code (ZCTA5) — Florida
- Housing Owner-Occupied % of Units, by Zip Code (ZCTA5) — West Virginia
- Bachelor's Degree or Higher (% of Over 25) by Zip Code (ZCTA5) — West Virginia
- High School Graduate (% of Over 25) by Zip Code (ZCTA5) — West Virginia
- Population Non-Hispanic American Indian % by Zip Code (ZCTA5) — West Virginia
- % of Population without Health Insurance, by Zip Code (ZCTA5) — West Virginia
- Housing % of Units Built Since 2010, by Zip Code (ZCTA5) — West Virginia
- Housing Median Monthly Rent ($), by Zip Code (ZCTA5) — West Virginia
- % of Households with Broadband Internet, by Zip Code (ZCTA5) — West Virginia
- Housing Owner-Occupied Median Value ($), by Zip Code (ZCTA5) — West Virginia
- U.S. Citizens by County (% of Population Over 18)
- High School Graduate (% of Over 25) by Zip Code (ZCTA5) — Philadelphia Metro
- High School Graduate (% of Over 25) by Zip Code (ZCTA5) — New York
- High School Graduate (% of Over 25) by Zip Code (ZCTA5) — California
- Population Non-Hispanic White % by Zip Code (ZCTA5) — New York
- Household Median Income by Zip Code (ZCTA5) — New York
- Population Non-Hispanic Black % by Zip Code (ZCTA5) — New York
- Population Hispanic % by Zip Code (ZCTA5) — New York
- % of Population on Food Stamps or SNAP (Last 12 Months), by Zip Code (ZCTA5) — Florida
- U.S. Citizens (% of Population Over 18) by Zip Code (ZCTA5) — New York
- Population Non-Hispanic American Indian % by Zip Code (ZCTA5) — New York
- Median Age by Zip Code (ZCTA5) — New York
- Population Non-Hispanic Asian % by Zip Code (ZCTA5) — West Virginia
- Population Hispanic % by Zip Code (ZCTA5) — Hawaii
- Housing Vacancy Rate by Zip Code (ZCTA5) — West Virginia
- % of Population on Food Stamps or SNAP (Last 12 Months), by Zip Code (ZCTA5) — West Virginia
- Population Non-Hispanic Black % by Zip Code (ZCTA5) — Hawaii
- Married Couple (% of all Households) by Zip Code (ZCTA5) — West Virginia
- U.S. Citizens (% of Population Over 18) by Zip Code (ZCTA5) — Hawaii
- Household Median Income by Zip Code (ZCTA5) — Hawaii
- Household Average Size by Zip Code (ZCTA5) — Virginia
- Household Average Size by Zip Code (ZCTA5) — Georgia
- Household Average Size by Zip Code (ZCTA5) — Vermont
- Household Average Size by Zip Code (ZCTA5) — Ohio
- Household Average Size by Zip Code (ZCTA5) — Iowa
- Household Average Size by Zip Code (ZCTA5) — Utah
- Household Average Size by Zip Code (ZCTA5) — California
- Household Average Size by Zip Code (ZCTA5) — Wyoming
- Household Average Size by Zip Code (ZCTA5) — Idaho
- Household Average Size by Zip Code (ZCTA5) — Hawaii