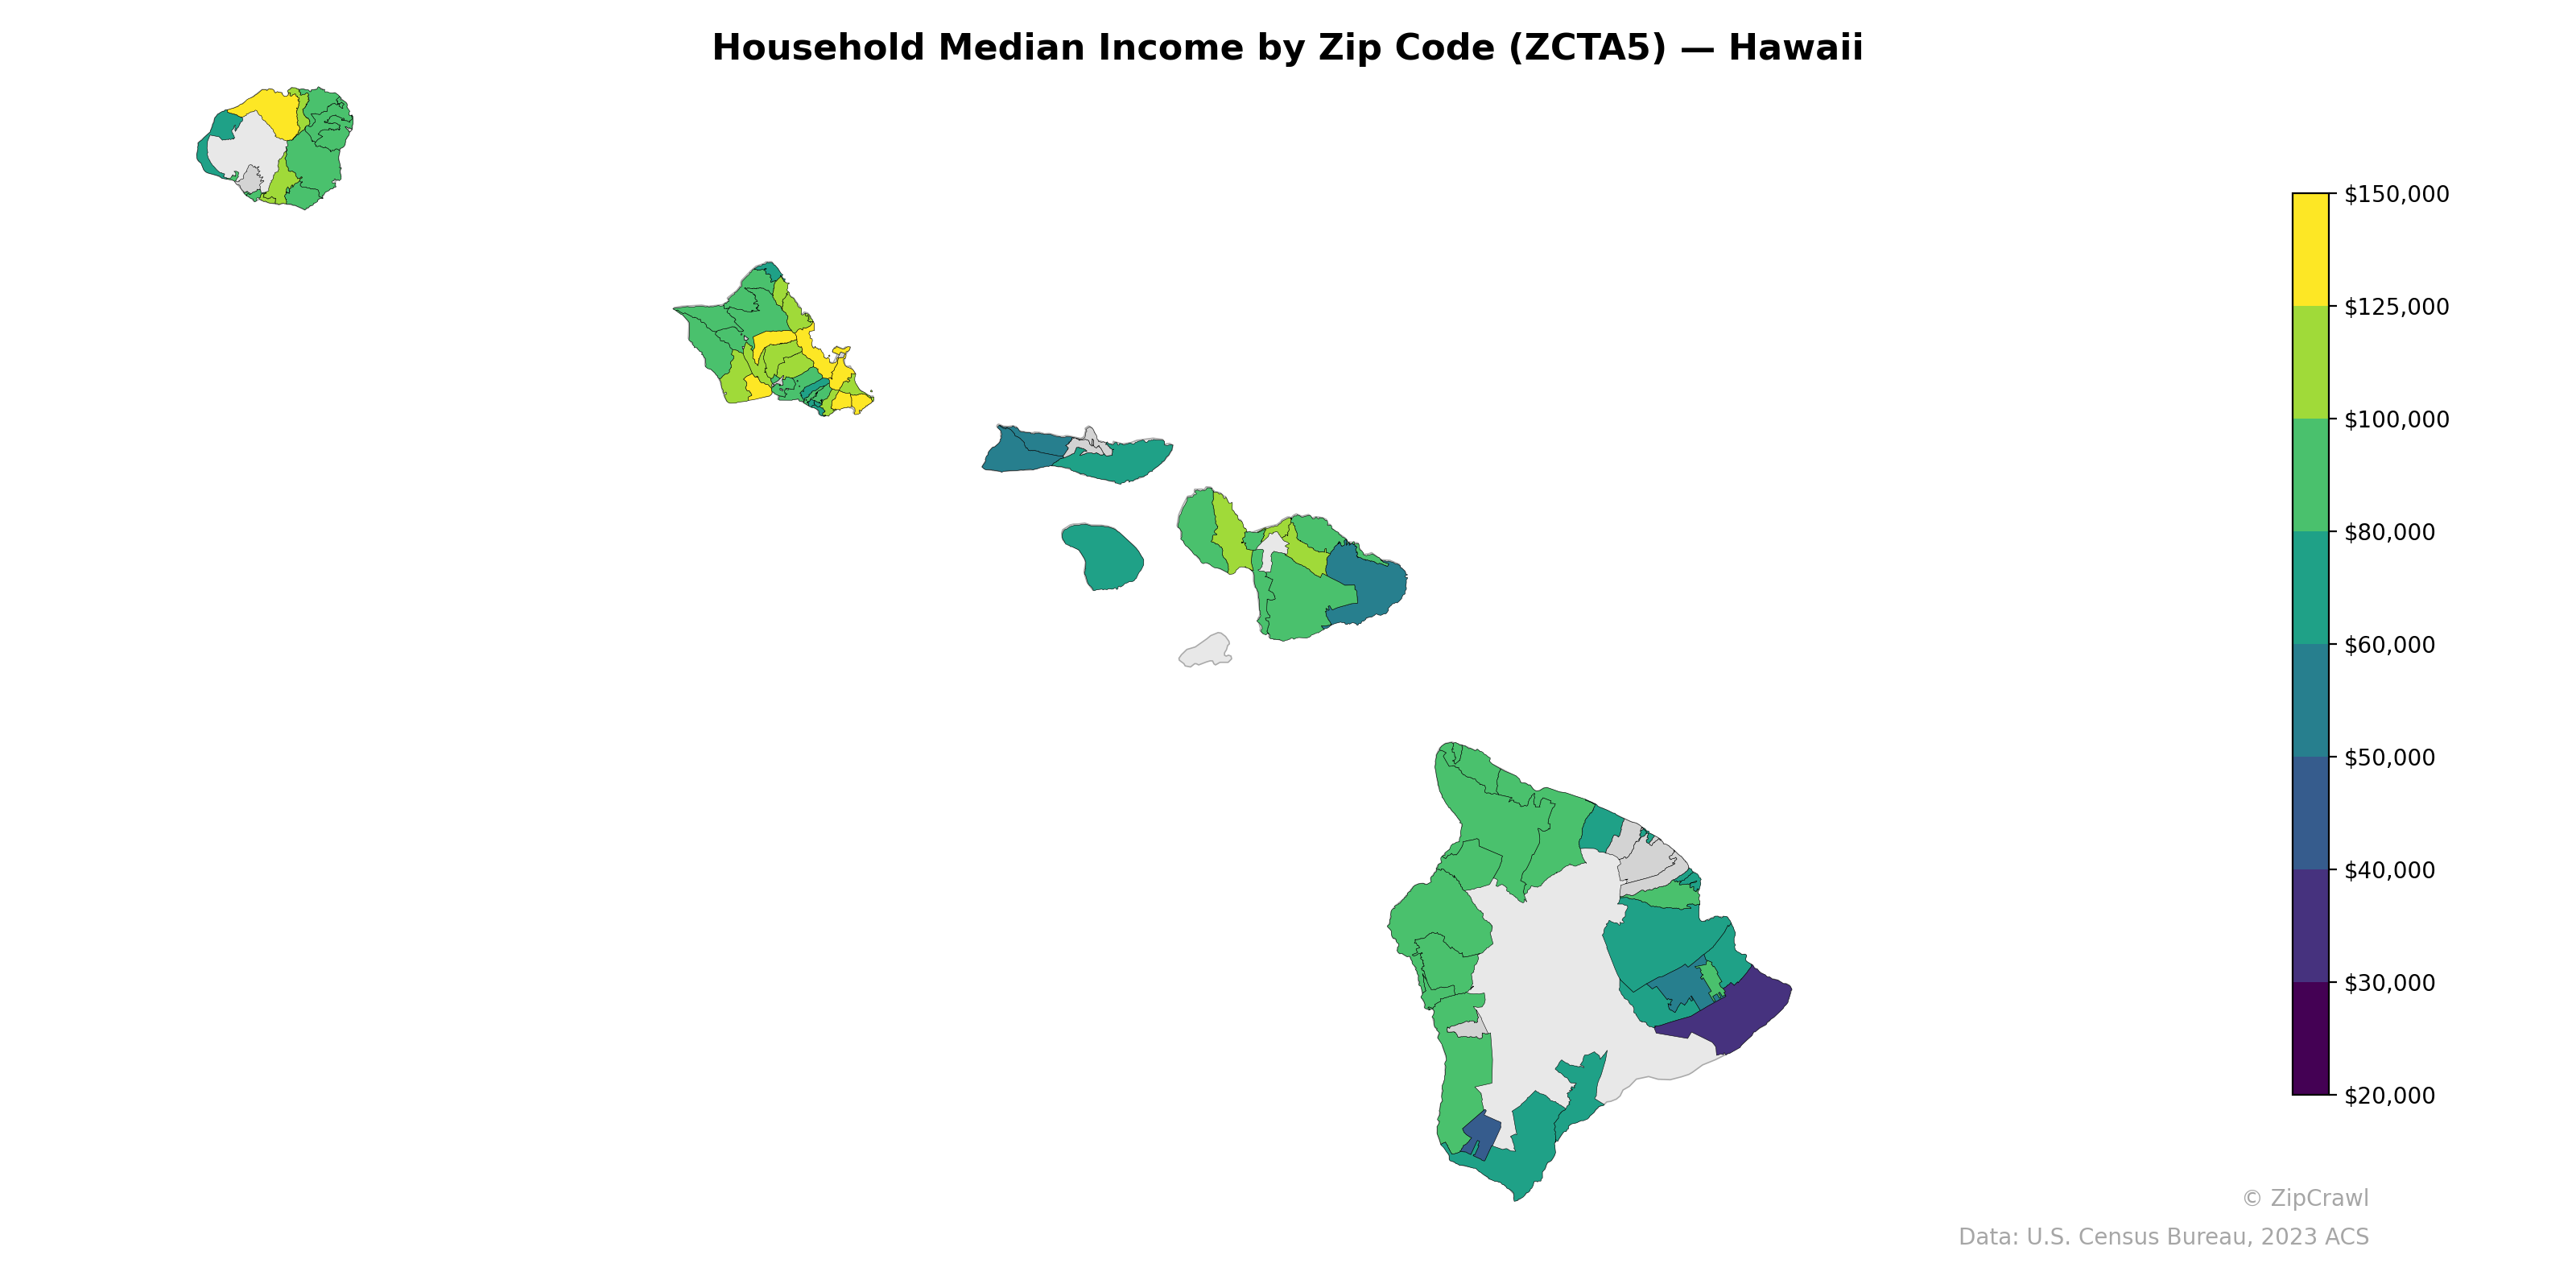
NOTE: Gray indicates insufficient data or a suppressed estimate.
Oahu's southern and eastern zip codes display the highest household median incomes in the state, with several areas exceeding $125,000, while the Big Island's southeastern Puna district and parts of downtown Hilo fall notably below $30,000, representing the sharpest income disparity across the archipelago. Kauai exhibits a clear north-south gradient, with the North Shore reaching above $100,000 and western areas dropping considerably. Maui's inland and southern zip codes generally outperform its central valley, and the neighbor islands of Molokai and Lanai cluster in the moderate-to-lower income range around $50,000–$70,000.
Data: U.S. Census Bureau, 2023 ACS
Explore
- % of Population on Food Stamps or SNAP (Last 12 Months), by Zip Code (ZCTA5) — Florida
- Population Hispanic % by Zip Code (ZCTA5) — Hawaii
- Population Non-Hispanic Asian % by Zip Code (ZCTA5) — West Virginia
- Housing Vacancy Rate by Zip Code (ZCTA5) — West Virginia
- % of Population on Food Stamps or SNAP (Last 12 Months), by Zip Code (ZCTA5) — West Virginia
- Population Non-Hispanic Black % by Zip Code (ZCTA5) — Hawaii
- Population Non-Hispanic White % by Zip Code (ZCTA5) — Hawaii
- Married Couple (% of all Households) by Zip Code (ZCTA5) — West Virginia
- Median Age by Zip Code (ZCTA5) — Hawaii
- U.S. Citizens (% of Population Over 18) by Zip Code (ZCTA5) — Hawaii
- U.S. Citizens by County (% of Population Over 18)
- Household Average Size by County
- Housing Median Monthly Rent ($), by Zip Code (ZCTA5) — California
- Housing Median Monthly Rent ($), by Zip Code (ZCTA5) — Philadelphia Metro
- Population Non-Hispanic Black % by Zip Code (ZCTA5) — New York
- Median Age by Zip Code (ZCTA5) — New York
- Population Non-Hispanic American Indian % by Zip Code (ZCTA5) — New York
- Population Non-Hispanic Asian % by Zip Code (ZCTA5) — Florida
- Population Hispanic % by Zip Code (ZCTA5) — New York
- U.S. Citizens (% of Population Over 18) by Zip Code (ZCTA5) — New York
- High School Graduate (% of Over 25) by Zip Code (ZCTA5) — New York
- Population Non-Hispanic White % by Zip Code (ZCTA5) — New York
- Housing Owner-Occupied % of Units, by Zip Code (ZCTA5) — West Virginia
- Bachelor's Degree or Higher (% of Over 25) by Zip Code (ZCTA5) — West Virginia
- % of Households with Broadband Internet, by Zip Code (ZCTA5) — West Virginia
- Population Non-Hispanic American Indian % by Zip Code (ZCTA5) — West Virginia
- High School Graduate (% of Over 25) by Zip Code (ZCTA5) — West Virginia
- Household Average Size by Zip Code (ZCTA5) — West Virginia
- % of Population without Health Insurance, by Zip Code (ZCTA5) — West Virginia
- Housing Owner-Occupied Median Value ($), by Zip Code (ZCTA5) — West Virginia
- Household Median Income by Zip Code (ZCTA5) — Iowa
- Household Median Income by Zip Code (ZCTA5) — Indiana
- Household Median Income by Zip Code (ZCTA5) — Utah
- Household Median Income by Zip Code (ZCTA5) — Maine
- Household Median Income by Zip Code (ZCTA5) — Idaho
- Household Median Income by Zip Code (ZCTA5) — Ohio
- Household Median Income by Zip Code (ZCTA5) — Texas
- Household Median Income by Zip Code (ZCTA5) — Delaware
- Household Median Income by Zip Code (ZCTA5) — Nevada
- Household Median Income by Zip Code (ZCTA5) — Colorado