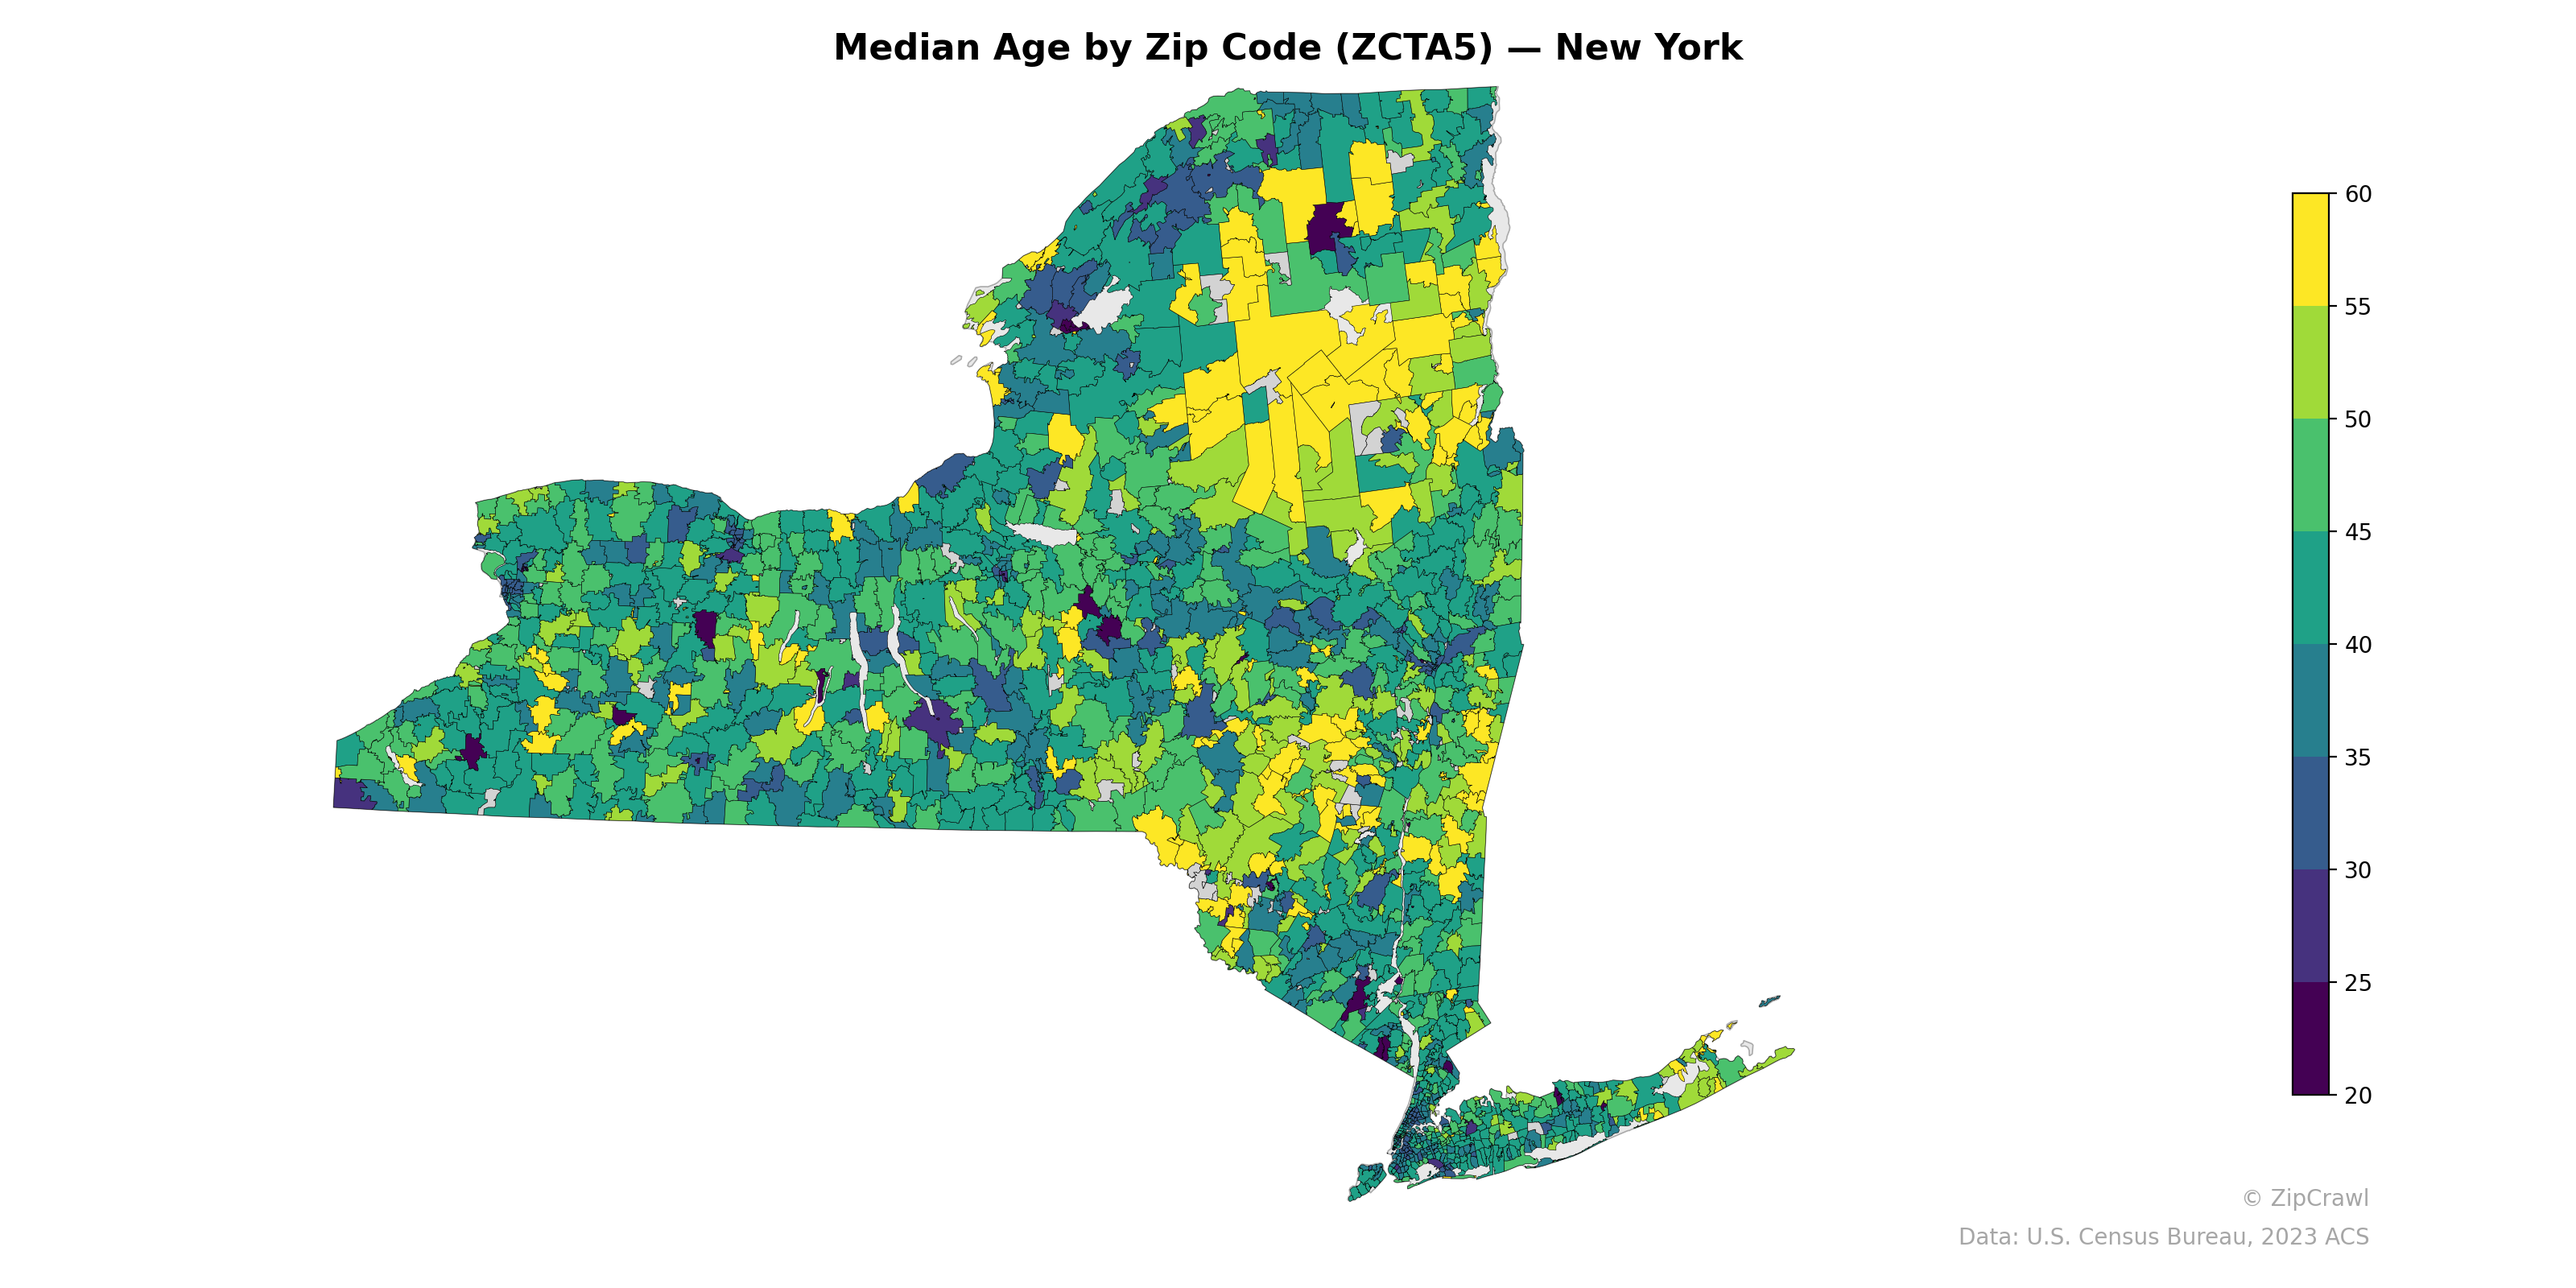
NOTE: Gray indicates insufficient data or a suppressed estimate.
The Adirondack region and parts of the eastern Capital District corridor exhibit notably higher median ages, with many zip codes reaching into the mid-50s to 60+, reflecting aging rural and retirement-oriented communities. In sharp contrast, New York City's boroughs—particularly the Bronx and parts of Brooklyn—display some of the youngest median ages in the state, dipping below 30 in several zip codes, likely driven by immigrant communities and younger urban demographics. A band of moderately elevated median ages (45–55) stretches across the suburban Lower Hudson Valley and Long Island's South Fork, while college towns such as Ithaca and areas near Syracuse show distinctly low values amid otherwise older surrounding regions.
Data: U.S. Census Bureau, 2023 ACS
Explore
- % of Population without Health Insurance, by Zip Code (ZCTA5) — New Hampshire
- Household Average Size by Zip Code (ZCTA5) — New Hampshire
- High School Graduate (% of Over 25) by Zip Code (ZCTA5) — New Hampshire
- Population Non-Hispanic American Indian % by Zip Code (ZCTA5) — New Hampshire
- Housing % of Units Built Since 2010, by Zip Code (ZCTA5) — New Hampshire
- Housing Median Monthly Rent ($), by Zip Code (ZCTA5) — New Hampshire
- Housing Owner-Occupied Median Value ($), by Zip Code (ZCTA5) — New Hampshire
- Housing Owner-Occupied % of Units, by Zip Code (ZCTA5) — New Hampshire
- Bachelor's Degree or Higher (% of Over 25) by Zip Code (ZCTA5) — New Hampshire
- % of Households with Broadband Internet, by Zip Code (ZCTA5) — New Hampshire
- U.S. Citizens by County (% of Population Over 18)
- Household Median Income by Zip Code (ZCTA5) — New York
- High School Graduate (% of Over 25) by Zip Code (ZCTA5) — New York
- Population Non-Hispanic White % by Zip Code (ZCTA5) — New York
- U.S. Citizens (% of Population Over 18) by Zip Code (ZCTA5) — New York
- Population Non-Hispanic Black % by Zip Code (ZCTA5) — New York
- Population Hispanic % by Zip Code (ZCTA5) — New York
- Population Non-Hispanic Asian % by Zip Code (ZCTA5) — Florida
- Population Non-Hispanic American Indian % by Zip Code (ZCTA5) — New York
- % of Population on Food Stamps or SNAP (Last 12 Months), by Zip Code (ZCTA5) — Florida
- Married Couple (% of all Households) by Zip Code (ZCTA5) — West Virginia
- % of Households with Broadband Internet, by Zip Code (ZCTA5) — West Virginia
- Housing Vacancy Rate by Zip Code (ZCTA5) — West Virginia
- % of Population without Health Insurance, by Zip Code (ZCTA5) — Kentucky
- % of Population without Health Insurance, by Zip Code (ZCTA5) — Iowa
- % of Population without Health Insurance, by Zip Code (ZCTA5) — New Mexico
- High School Graduate (% of Over 25) by Zip Code (ZCTA5) — West Virginia
- Population Non-Hispanic American Indian % by Zip Code (ZCTA5) — West Virginia
- Bachelor's Degree or Higher (% of Over 25) by Zip Code (ZCTA5) — West Virginia
- Population Hispanic % by Zip Code (ZCTA5) — Hawaii
- Median Age by Zip Code (ZCTA5) — New York Metro
- Median Age by Zip Code (ZCTA5) — New Mexico
- Median Age by Zip Code (ZCTA5) — New Jersey
- Median Age by Zip Code (ZCTA5) — Nevada
- Median Age by Zip Code (ZCTA5) — Nebraska
- Median Age by Zip Code (ZCTA5) — New Hampshire
- Median Age by Zip Code (ZCTA5) — Utah
- Median Age by Zip Code (ZCTA5) — Ohio
- Median Age by Zip Code (ZCTA5) — Iowa
- Median Age by Zip Code (ZCTA5) — Maine