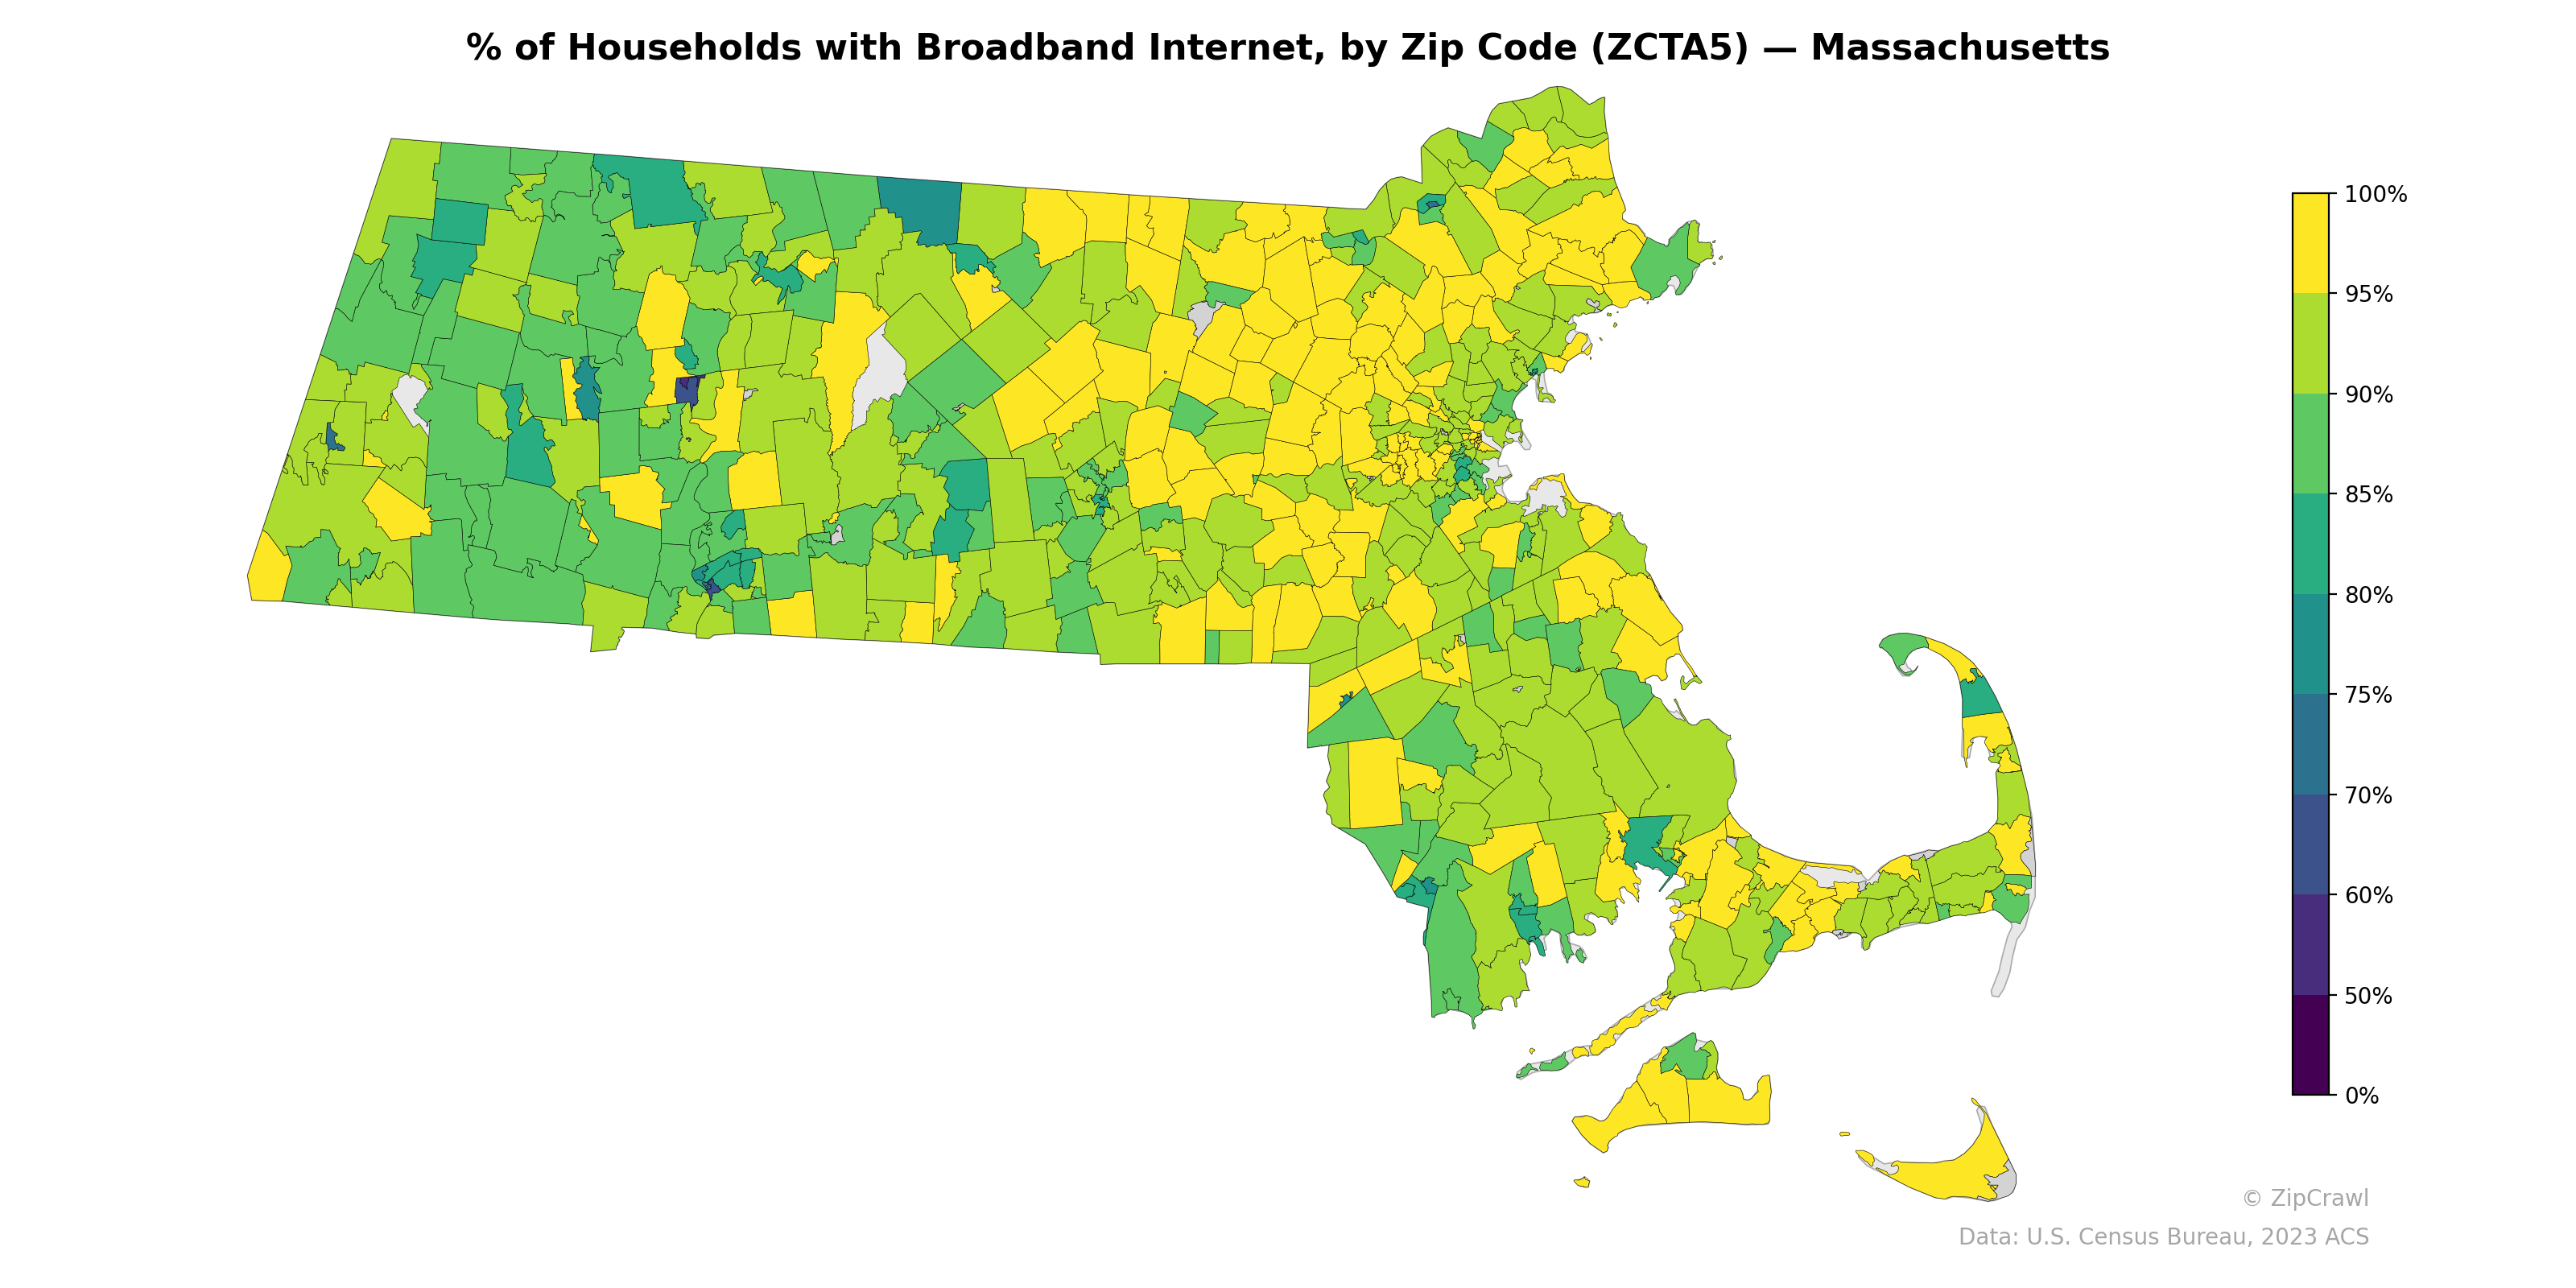
NOTE: Gray indicates insufficient data or a suppressed estimate.
Suburban zip codes west and south of Boston—particularly in the MetroWest corridor and communities along Route 128—consistently reach 90–100% broadband adoption, while several zip codes in the western Berkshires and rural hilltowns of Franklin and Hampshire counties fall noticeably lower, into the 60–80% range. Parts of the outer Cape Cod and the Islands also display lower broadband penetration compared to the mainland, likely reflecting a mix of seasonal housing stock and infrastructure limitations. Within the Greater Boston core, a few urban zip codes—potentially corresponding to lower-income neighborhoods in cities like Springfield, Worcester, and Boston proper—show measurably lower rates than their affluent suburban neighbors, highlighting a persistent digital divide along socioeconomic lines.
Data: U.S. Census Bureau, 2023 ACS
Explore
- Housing Owner-Occupied % of Units, by Zip Code (ZCTA5) — Los Angeles Metro
- Married Couple (% of all Households) by Zip Code (ZCTA5) — Massachusetts
- Housing Owner-Occupied Median Value ($), by Zip Code (ZCTA5) — Massachusetts
- Housing % of Units Built Since 2010, by Zip Code (ZCTA5) — Massachusetts
- Bachelor's Degree or Higher (% of Over 25) by Zip Code (ZCTA5) — Massachusetts
- % of Population without Health Insurance, by Zip Code (ZCTA5) — Massachusetts
- Household Average Size by Zip Code (ZCTA5) — Massachusetts
- Housing Median Monthly Rent ($), by Zip Code (ZCTA5) — Massachusetts
- Housing Vacancy Rate by Zip Code (ZCTA5) — Massachusetts
- Housing Owner-Occupied % of Units, by Zip Code (ZCTA5) — Massachusetts
- Housing Vacancy Rate by Zip Code (ZCTA5) — Delaware
- Population Non-Hispanic Black % by County
- Married Couple (% of all Households) by Zip Code (ZCTA5) — Los Angeles Metro
- Housing Vacancy Rate by Zip Code (ZCTA5) — Los Angeles Metro
- Housing Owner-Occupied Median Value ($), by Zip Code (ZCTA5) — Los Angeles Metro
- Housing % of Units Built Since 2010, by Zip Code (ZCTA5) — Los Angeles Metro
- % of Population without Health Insurance, by Zip Code (ZCTA5) — Los Angeles Metro
- Housing Median Monthly Rent ($), by Zip Code (ZCTA5) — Los Angeles Metro
- Bachelor's Degree or Higher (% of Over 25) by Zip Code (ZCTA5) — Los Angeles Metro
- Household Average Size by Zip Code (ZCTA5) — Los Angeles Metro
- Household Average Size by Zip Code (ZCTA5) — Tennessee
- Housing Median Monthly Rent ($), by Zip Code (ZCTA5) — Tennessee
- Married Couple (% of all Households) by Zip Code (ZCTA5) — Tennessee
- High School Graduate (% of Over 25) by Zip Code (ZCTA5) — Tennessee
- Population Non-Hispanic American Indian % by Zip Code (ZCTA5) — Tennessee
- Bachelor's Degree or Higher (% of Over 25) by Zip Code (ZCTA5) — Tennessee
- Housing Owner-Occupied % of Units, by Zip Code (ZCTA5) — Tennessee
- Housing Owner-Occupied Median Value ($), by Zip Code (ZCTA5) — Tennessee
- Housing % of Units Built Since 2010, by Zip Code (ZCTA5) — Tennessee
- Population Hispanic % by Zip Code (ZCTA5) — Tennessee
- % of Households with Broadband Internet, by Zip Code (ZCTA5) — Maine
- % of Households with Broadband Internet, by Zip Code (ZCTA5) — Maryland
- % of Households with Broadband Internet, by Zip Code (ZCTA5) — Iowa
- % of Households with Broadband Internet, by Zip Code (ZCTA5) — Ohio
- % of Households with Broadband Internet, by Zip Code (ZCTA5) — Idaho
- % of Households with Broadband Internet, by Zip Code (ZCTA5) — Utah
- % of Households with Broadband Internet, by Zip Code (ZCTA5) — Montana
- % of Households with Broadband Internet, by Zip Code (ZCTA5) — Texas
- % of Households with Broadband Internet, by Zip Code (ZCTA5) — Oregon
- % of Households with Broadband Internet, by Zip Code (ZCTA5) — Indiana