NOTE: Gray indicates insufficient data or a suppressed estimate.
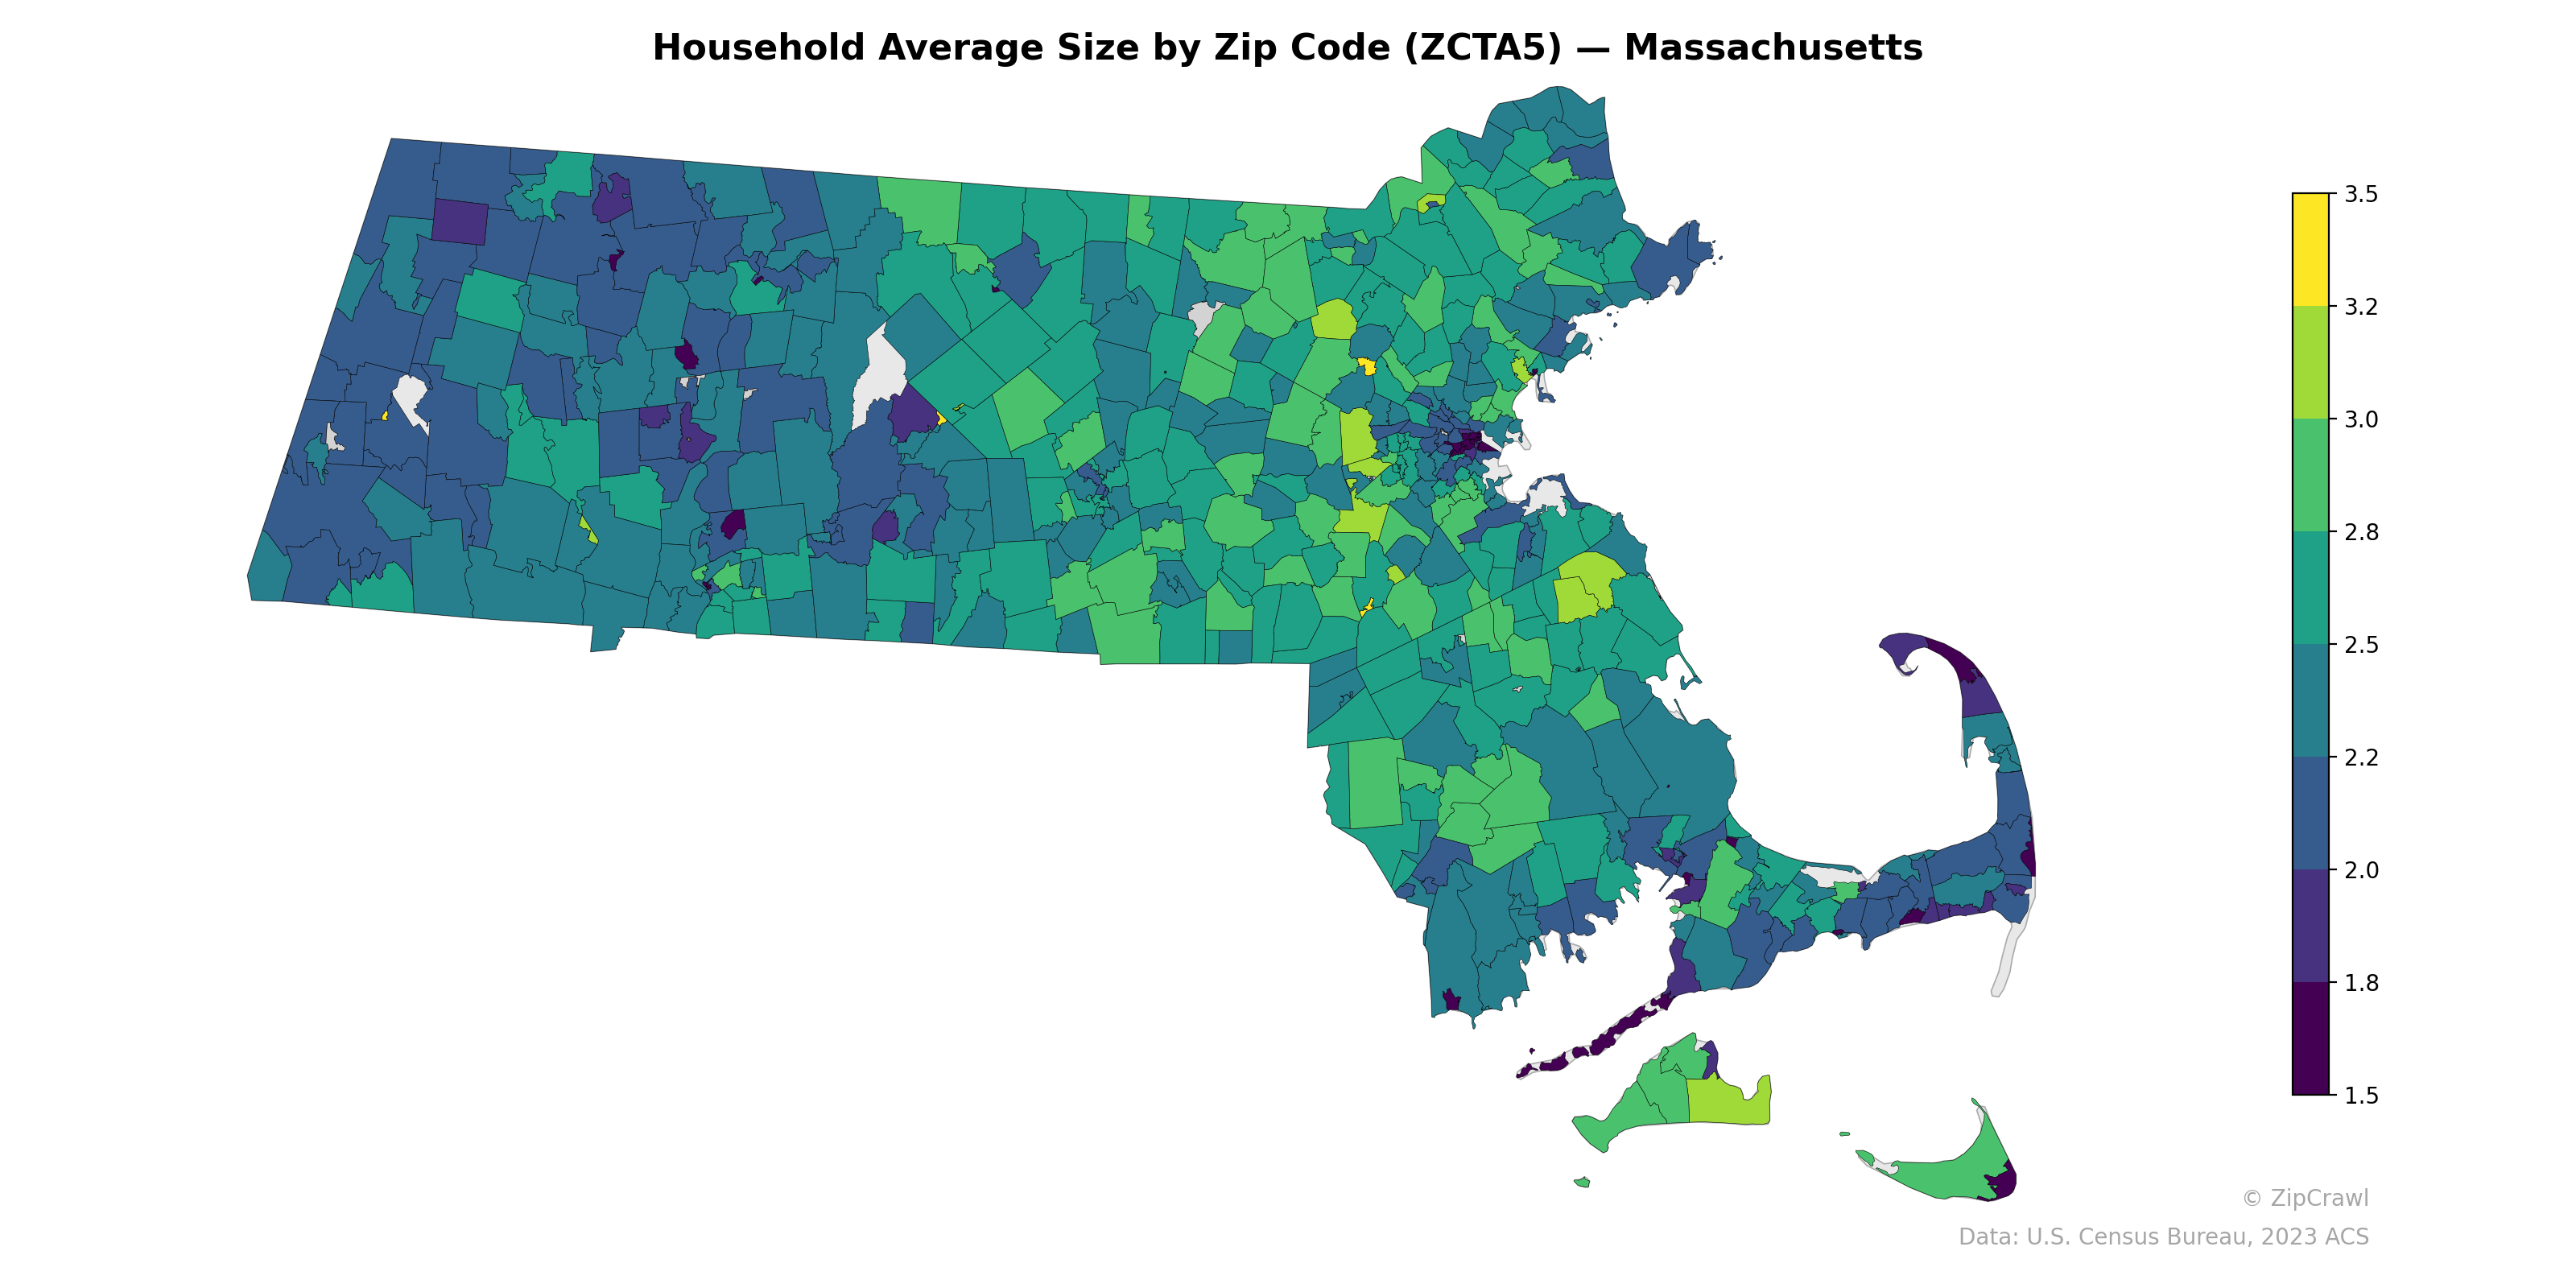
Suburban zip codes south and west of Boston—particularly in the MetroWest corridor and communities like those in Norfolk and Middlesex counties—consistently display higher average household sizes in the 2.8–3.2 range, reflecting family-oriented residential areas. In contrast, the western portion of the state, including the Berkshires and Pioneer Valley college towns, skews notably lower at 2.0–2.4, as does Provincetown at the tip of Cape Cod, which registers among the smallest averages statewide. A handful of zip codes in the Greater Boston core and Nantucket fall below 1.8, likely driven by concentrations of single-person households, student populations, or seasonal housing stock.
Data: U.S. Census Bureau, 2023 ACS
Explore
- Housing Owner-Occupied % of Units, by Zip Code (ZCTA5) — Los Angeles Metro
- Housing % of Units Built Since 2010, by Zip Code (ZCTA5) — Massachusetts
- % of Population without Health Insurance, by Zip Code (ZCTA5) — Massachusetts
- Housing Median Monthly Rent ($), by Zip Code (ZCTA5) — Massachusetts
- Bachelor's Degree or Higher (% of Over 25) by Zip Code (ZCTA5) — Massachusetts
- Housing Owner-Occupied Median Value ($), by Zip Code (ZCTA5) — Massachusetts
- Married Couple (% of all Households) by Zip Code (ZCTA5) — Massachusetts
- Housing Vacancy Rate by Zip Code (ZCTA5) — Massachusetts
- % of Households with Broadband Internet, by Zip Code (ZCTA5) — Massachusetts
- Housing Owner-Occupied % of Units, by Zip Code (ZCTA5) — Massachusetts
- Population Non-Hispanic White % by Zip Code (ZCTA5) — South Dakota
- Population Non-Hispanic Black % by County
- Housing Vacancy Rate by Zip Code (ZCTA5) — Los Angeles Metro
- Housing % of Units Built Since 2010, by Zip Code (ZCTA5) — Los Angeles Metro
- Married Couple (% of all Households) by Zip Code (ZCTA5) — Los Angeles Metro
- % of Population without Health Insurance, by Zip Code (ZCTA5) — Los Angeles Metro
- Housing Owner-Occupied Median Value ($), by Zip Code (ZCTA5) — Los Angeles Metro
- Bachelor's Degree or Higher (% of Over 25) by Zip Code (ZCTA5) — Los Angeles Metro
- Married Couple (% of all Households) by Zip Code (ZCTA5) — New York Metro
- % of Households with Broadband Internet, by Zip Code (ZCTA5) — Los Angeles Metro
- Housing Median Monthly Rent ($), by Zip Code (ZCTA5) — Los Angeles Metro
- Housing Median Monthly Rent ($), by Zip Code (ZCTA5) — Tennessee
- Housing Owner-Occupied % of Units, by Zip Code (ZCTA5) — Tennessee
- Housing % of Units Built Since 2010, by Zip Code (ZCTA5) — Tennessee
- Population Non-Hispanic American Indian % by Zip Code (ZCTA5) — Tennessee
- Population Non-Hispanic Black % by Zip Code (ZCTA5) — Tennessee
- % of Households with Broadband Internet, by Zip Code (ZCTA5) — Tennessee
- % of Population without Health Insurance, by Zip Code (ZCTA5) — Tennessee
- Housing Owner-Occupied Median Value ($), by Zip Code (ZCTA5) — Tennessee
- High School Graduate (% of Over 25) by Zip Code (ZCTA5) — Tennessee
- Household Average Size by Zip Code (ZCTA5) — Maine
- Household Average Size by Zip Code (ZCTA5) — Maryland
- Household Average Size by Zip Code (ZCTA5) — Iowa
- Household Average Size by Zip Code (ZCTA5) — Utah
- Household Average Size by Zip Code (ZCTA5) — Ohio
- Household Average Size by Zip Code (ZCTA5) — Montana
- Household Average Size by Zip Code (ZCTA5) — Idaho
- Household Average Size by Zip Code (ZCTA5) — Hawaii
- Household Average Size by Zip Code (ZCTA5) — Texas
- Household Average Size by Zip Code (ZCTA5) — Alaska