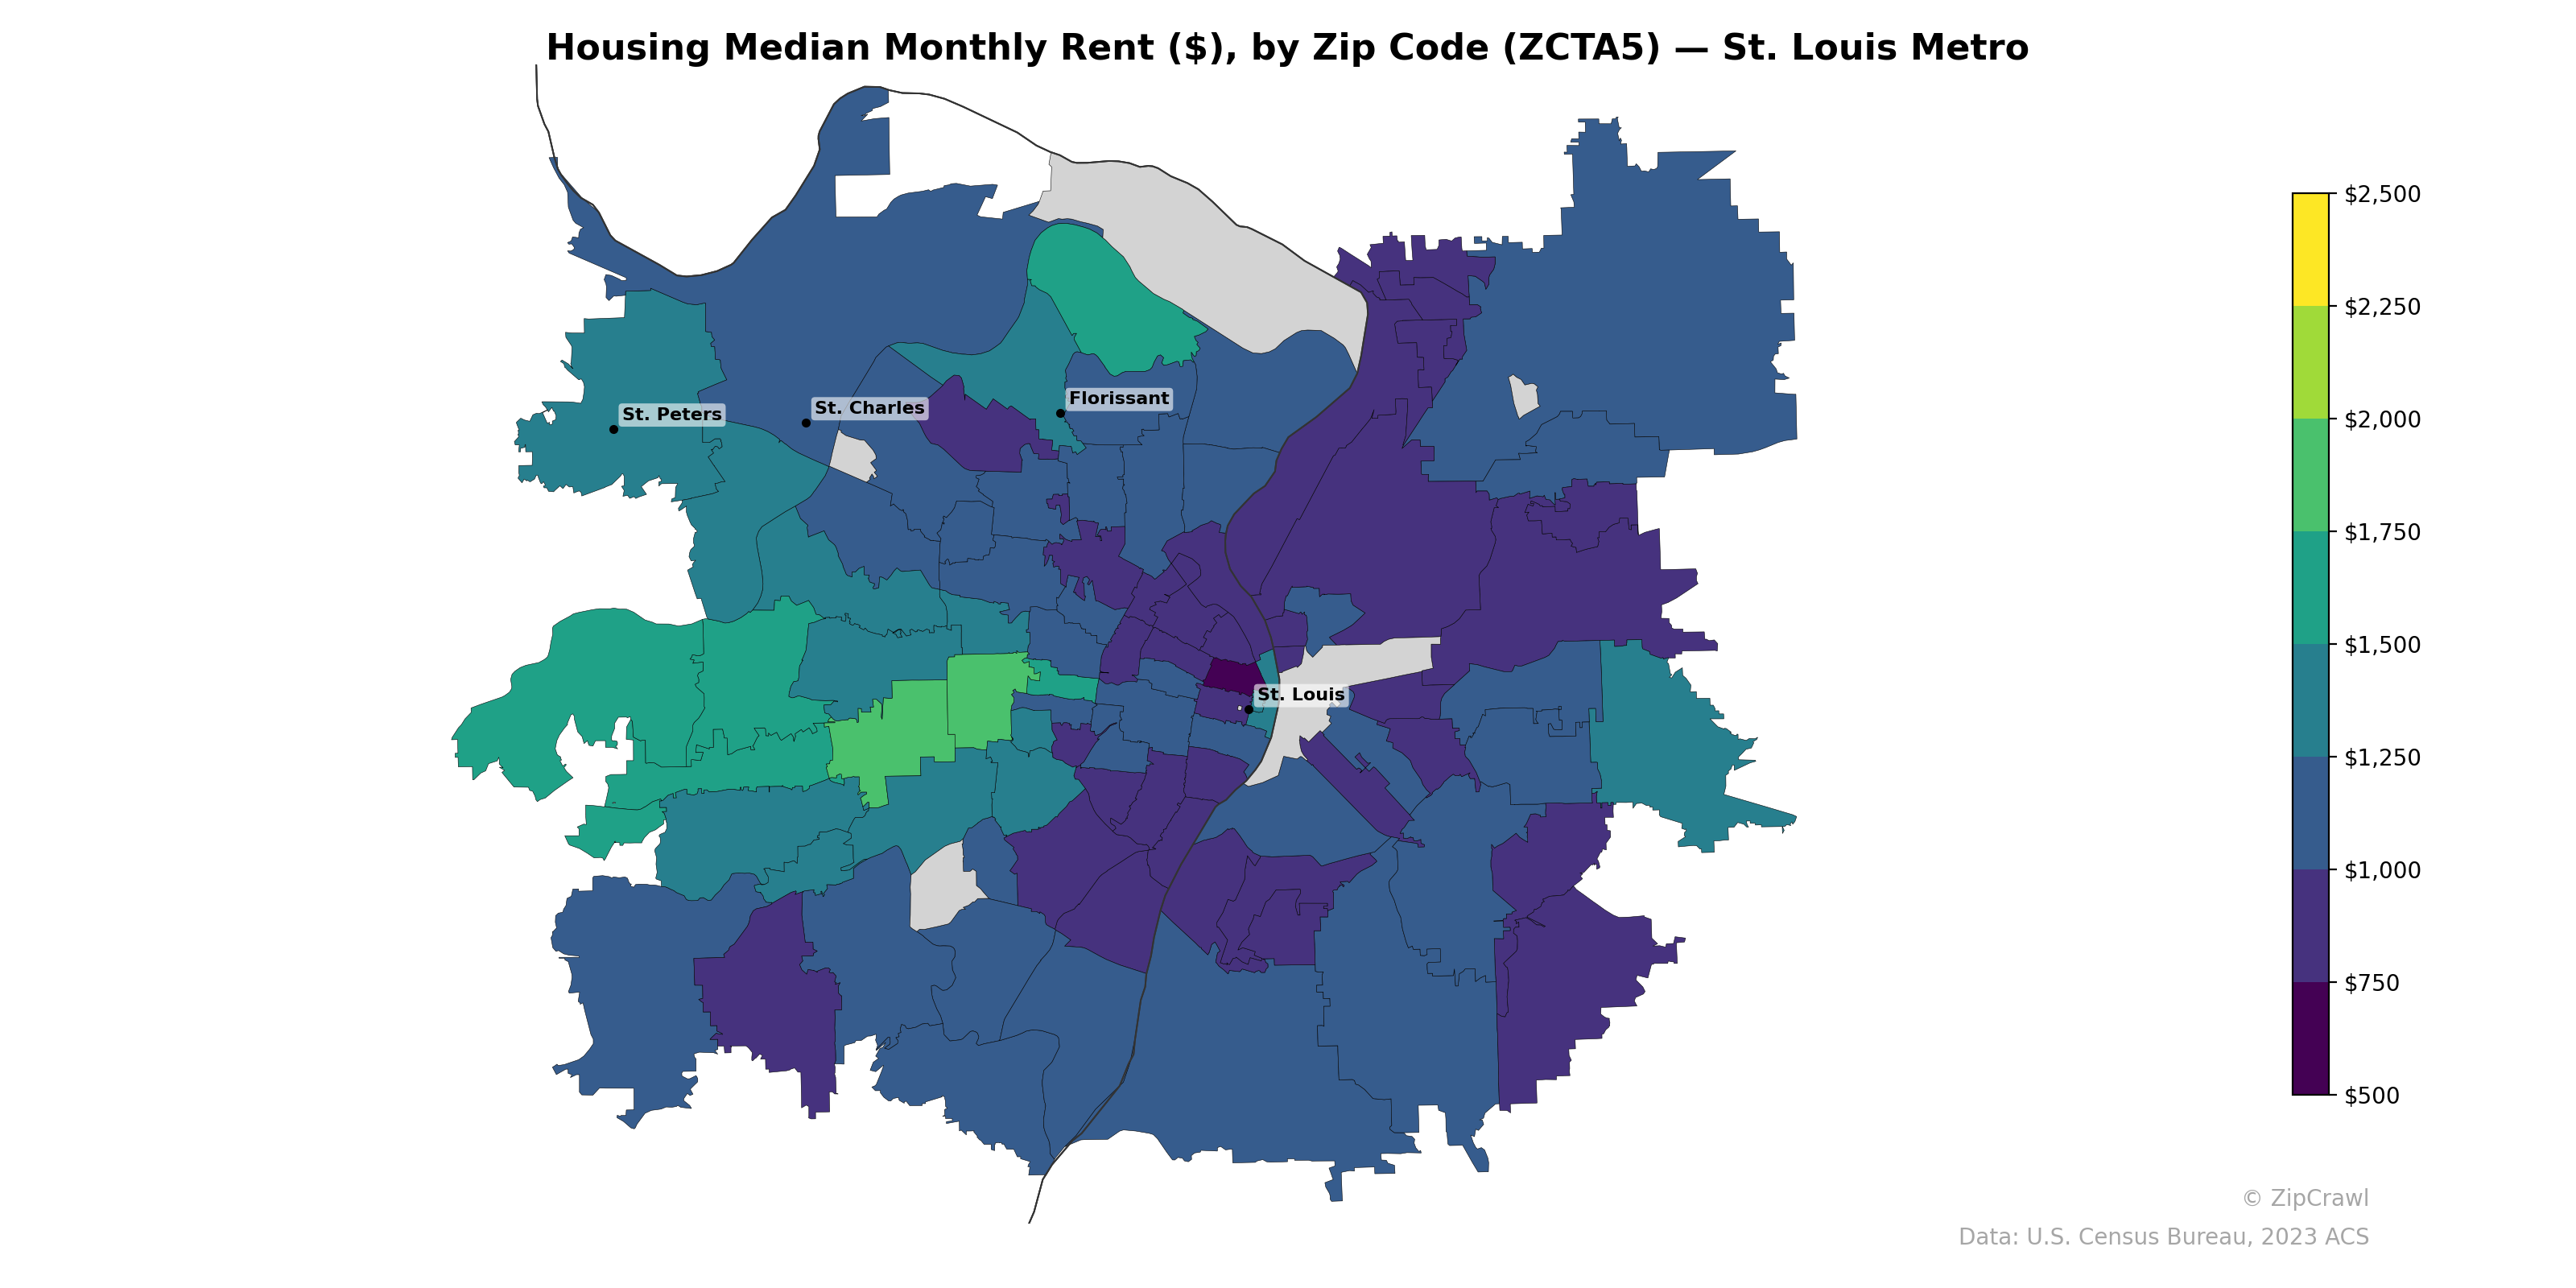
NOTE: Gray indicates insufficient data or a suppressed estimate.
Median rents in the St. Louis metro area display a clear east-west gradient, with the lowest rents—often below $750—concentrated in zip codes within and immediately surrounding the City of St. Louis and north St. Louis County near Florissant, while western suburbs including St. Peters, St. Charles, and the southwestern corridor consistently reach $1,250 to $1,750+. A notable cluster of higher rents appears in the far western and southwestern periphery of the metro, with a few zip codes north of St. Charles approaching $2,000–$2,500, suggesting newer suburban development commanding premium prices. The starkest contrast exists between the deep purple zip codes in north St. Louis city—where rents fall near $500—and affluent pockets just 15–20 miles west where rents are three to four times higher.
Data: U.S. Census Bureau, 2023 ACS
Explore
- Household Median Income by Zip Code (ZCTA5) — Texas
- Housing Vacancy Rate by Zip Code (ZCTA5) — St. Louis Metro
- Housing Owner-Occupied % of Units, by Zip Code (ZCTA5) — St. Louis Metro
- % of Households with Broadband Internet, by Zip Code (ZCTA5) — St. Louis Metro
- Married Couple (% of all Households) by Zip Code (ZCTA5) — St. Louis Metro
- Housing Owner-Occupied Median Value ($), by Zip Code (ZCTA5) — St. Louis Metro
- Housing % of Units Built Since 2010, by Zip Code (ZCTA5) — St. Louis Metro
- % of Population without Health Insurance, by Zip Code (ZCTA5) — St. Louis Metro
- Household Average Size by Zip Code (ZCTA5) — St. Louis Metro
- Bachelor's Degree or Higher (% of Over 25) by Zip Code (ZCTA5) — St. Louis Metro
- High School Graduate (% of Over 25) by County
- Population Non-Hispanic White % by Zip Code (ZCTA5) — Texas
- U.S. Citizens (% of Population Over 18) by Zip Code (ZCTA5) — Texas
- Population Non-Hispanic Asian % by Zip Code (ZCTA5) — Chicago Metro
- High School Graduate (% of Over 25) by Zip Code (ZCTA5) — Texas
- % of Population on Food Stamps or SNAP (Last 12 Months), by Zip Code (ZCTA5) — Chicago Metro
- Population Hispanic % by Zip Code (ZCTA5) — Texas
- Median Age by Zip Code (ZCTA5) — Texas
- Population Non-Hispanic Black % by Zip Code (ZCTA5) — Texas
- Housing % of Units Built Since 2010, by Zip Code (ZCTA5) — New York Metro
- Population Non-Hispanic American Indian % by Zip Code (ZCTA5) — Texas
- % of Households with Broadband Internet, by Zip Code (ZCTA5) — Baltimore Metro
- Bachelor's Degree or Higher (% of Over 25) by Zip Code (ZCTA5) — Baltimore Metro
- % of Population without Health Insurance, by Zip Code (ZCTA5) — Baltimore Metro
- Population Non-Hispanic Asian % by Zip Code (ZCTA5) — Charlotte Metro
- Population Non-Hispanic Asian % by Zip Code (ZCTA5) — Baltimore Metro
- Household Median Income by Zip Code (ZCTA5) — Baltimore Metro
- High School Graduate (% of Over 25) by Zip Code (ZCTA5) — Baltimore Metro
- % of Population on Food Stamps or SNAP (Last 12 Months), by Zip Code (ZCTA5) — Charlotte Metro
- Population Non-Hispanic Black % by Zip Code (ZCTA5) — Baltimore Metro
- Housing Median Monthly Rent ($), by Zip Code (ZCTA5) — Louisiana
- Housing Median Monthly Rent ($), by Zip Code (ZCTA5) — Houston Metro
- Housing Median Monthly Rent ($), by Zip Code (ZCTA5) — Miami Metro
- Housing Median Monthly Rent ($), by Zip Code (ZCTA5) — Seattle Metro
- Housing Median Monthly Rent ($), by Zip Code (ZCTA5) — Boston Metro
- Housing Median Monthly Rent ($), by Zip Code (ZCTA5) — Tampa Metro
- Housing Median Monthly Rent ($), by Zip Code (ZCTA5) — Detroit Metro
- Housing Median Monthly Rent ($), by Zip Code (ZCTA5) — San Diego Metro
- Housing Median Monthly Rent ($), by Zip Code (ZCTA5) — Chicago Metro
- Housing Median Monthly Rent ($), by Zip Code (ZCTA5) — Dallas Metro