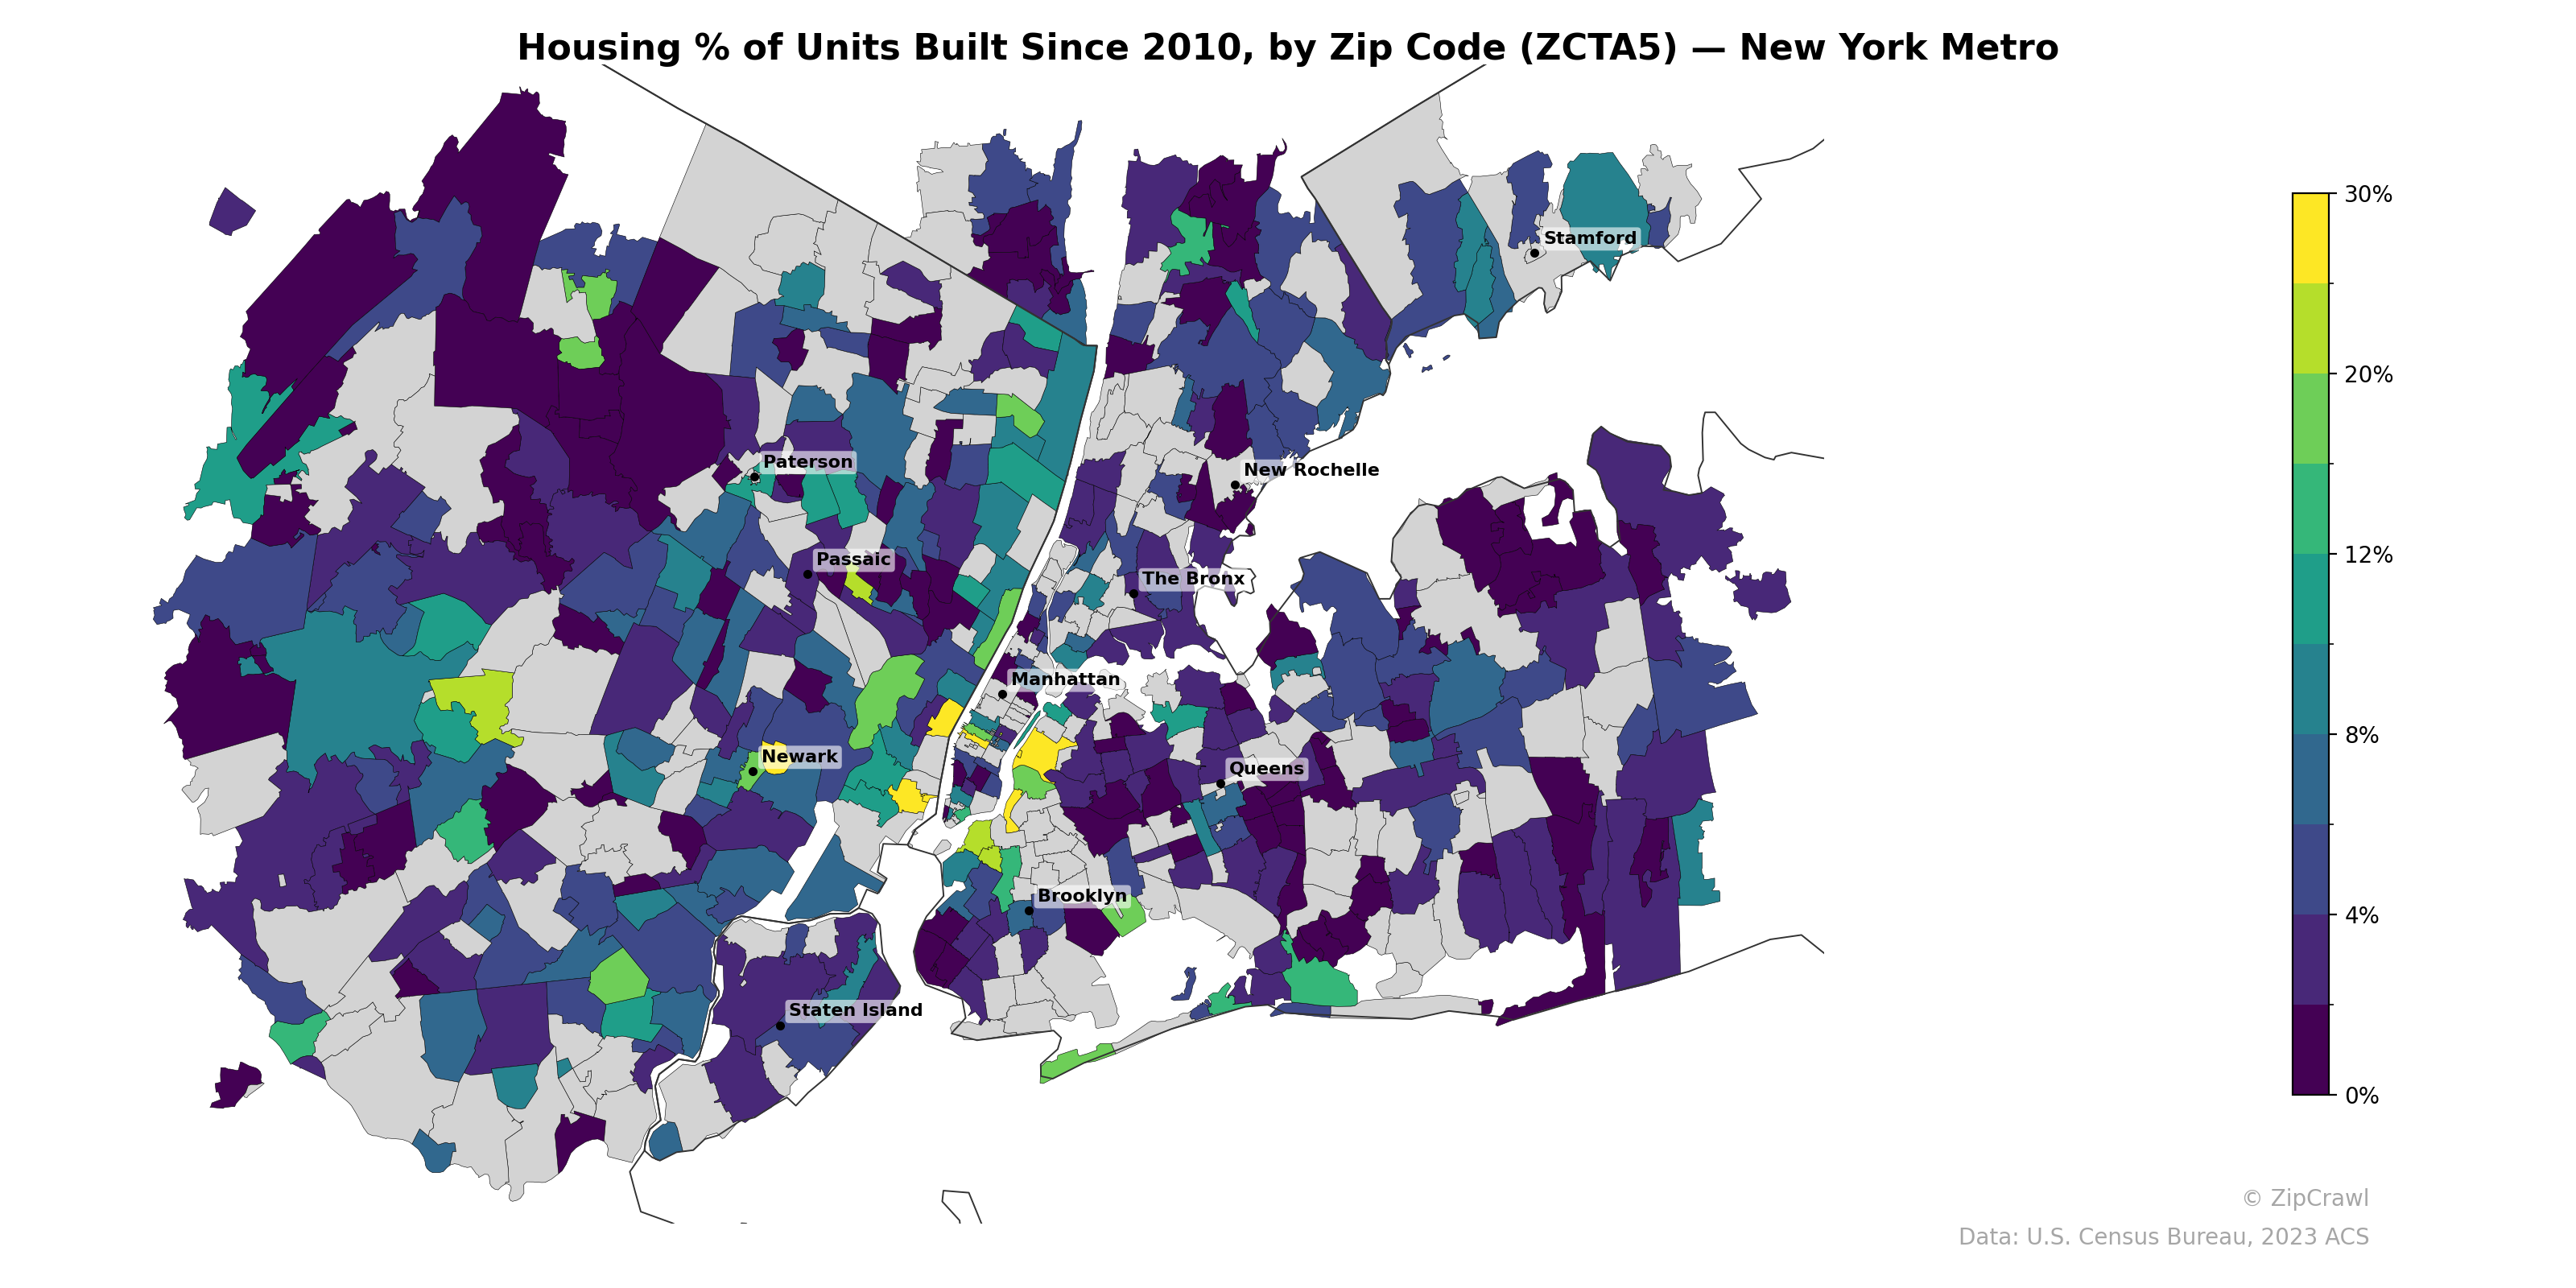
NOTE: Gray indicates insufficient data or a suppressed estimate.
New construction activity since 2010 concentrates most visibly along the Brooklyn-Queens waterfront and in pockets of lower Manhattan, where several zip codes exceed 20–30% of housing stock built in the past decade, reflecting major residential development corridors like Williamsburg, Long Island City, and Hudson Yards. Suburban New Jersey displays a patchwork pattern with scattered high-growth zip codes interspersed among areas with minimal new construction, while much of the Bronx and eastern Queens remain predominantly dark purple, indicating very little post-2010 building. The northern suburbs near Stamford show an isolated cluster of elevated new construction, contrasting with the generally low-growth areas across most of Westchester County.
Data: U.S. Census Bureau, 2023 ACS
Explore
- Housing Vacancy Rate by Zip Code (ZCTA5) — New Jersey
- Household Average Size by Zip Code (ZCTA5) — New Jersey
- % of Population without Health Insurance, by Zip Code (ZCTA5) — New Jersey
- Married Couple (% of all Households) by Zip Code (ZCTA5) — New Jersey
- Housing Median Monthly Rent ($), by Zip Code (ZCTA5) — Michigan
- % of Households with Broadband Internet, by Zip Code (ZCTA5) — New Jersey
- Bachelor's Degree or Higher (% of Over 25) by Zip Code (ZCTA5) — New Jersey
- Housing Median Monthly Rent ($), by Zip Code (ZCTA5) — New Jersey
- Housing Owner-Occupied Median Value ($), by Zip Code (ZCTA5) — New Jersey
- Housing Owner-Occupied % of Units, by Zip Code (ZCTA5) — New Jersey
- Population Non-Hispanic White % by County
- % of Population without Health Insurance, by Zip Code (ZCTA5) — New York Metro
- Married Couple (% of all Households) by Zip Code (ZCTA5) — New York Metro
- Housing Owner-Occupied Median Value ($), by Zip Code (ZCTA5) — New York Metro
- % of Households with Broadband Internet, by Zip Code (ZCTA5) — New York Metro
- Housing Vacancy Rate by Zip Code (ZCTA5) — New York Metro
- Housing Median Monthly Rent ($), by Zip Code (ZCTA5) — New York Metro
- Household Average Size by Zip Code (ZCTA5) — New York Metro
- Population Non-Hispanic Asian % by Zip Code (ZCTA5) — New York Metro
- Married Couple (% of all Households) by Zip Code (ZCTA5) — North Carolina
- Housing Median Monthly Rent ($), by Zip Code (ZCTA5) — North Carolina
- Housing Vacancy Rate by Zip Code (ZCTA5) — North Carolina
- High School Graduate (% of Over 25) by Zip Code (ZCTA5) — North Carolina
- % of Households with Broadband Internet, by Zip Code (ZCTA5) — North Carolina
- Population Non-Hispanic Black % by Zip Code (ZCTA5) — North Carolina
- Bachelor's Degree or Higher (% of Over 25) by Zip Code (ZCTA5) — North Carolina
- Housing Owner-Occupied % of Units, by Zip Code (ZCTA5) — North Carolina
- Housing Owner-Occupied Median Value ($), by Zip Code (ZCTA5) — North Carolina
- Household Average Size by Zip Code (ZCTA5) — North Carolina
- Population Non-Hispanic American Indian % by Zip Code (ZCTA5) — North Carolina
- Housing % of Units Built Since 2010, by Zip Code (ZCTA5) — New York
- Housing % of Units Built Since 2010, by Zip Code (ZCTA5) — Houston Metro
- Housing % of Units Built Since 2010, by Zip Code (ZCTA5) — Miami Metro
- Housing % of Units Built Since 2010, by Zip Code (ZCTA5) — New Mexico
- Housing % of Units Built Since 2010, by Zip Code (ZCTA5) — Detroit Metro
- Housing % of Units Built Since 2010, by Zip Code (ZCTA5) — Tampa Metro
- Housing % of Units Built Since 2010, by Zip Code (ZCTA5) — Boston Metro
- Housing % of Units Built Since 2010, by Zip Code (ZCTA5) — Denver Metro
- Housing % of Units Built Since 2010, by Zip Code (ZCTA5) — Dallas Metro
- Housing % of Units Built Since 2010, by Zip Code (ZCTA5) — Chicago Metro