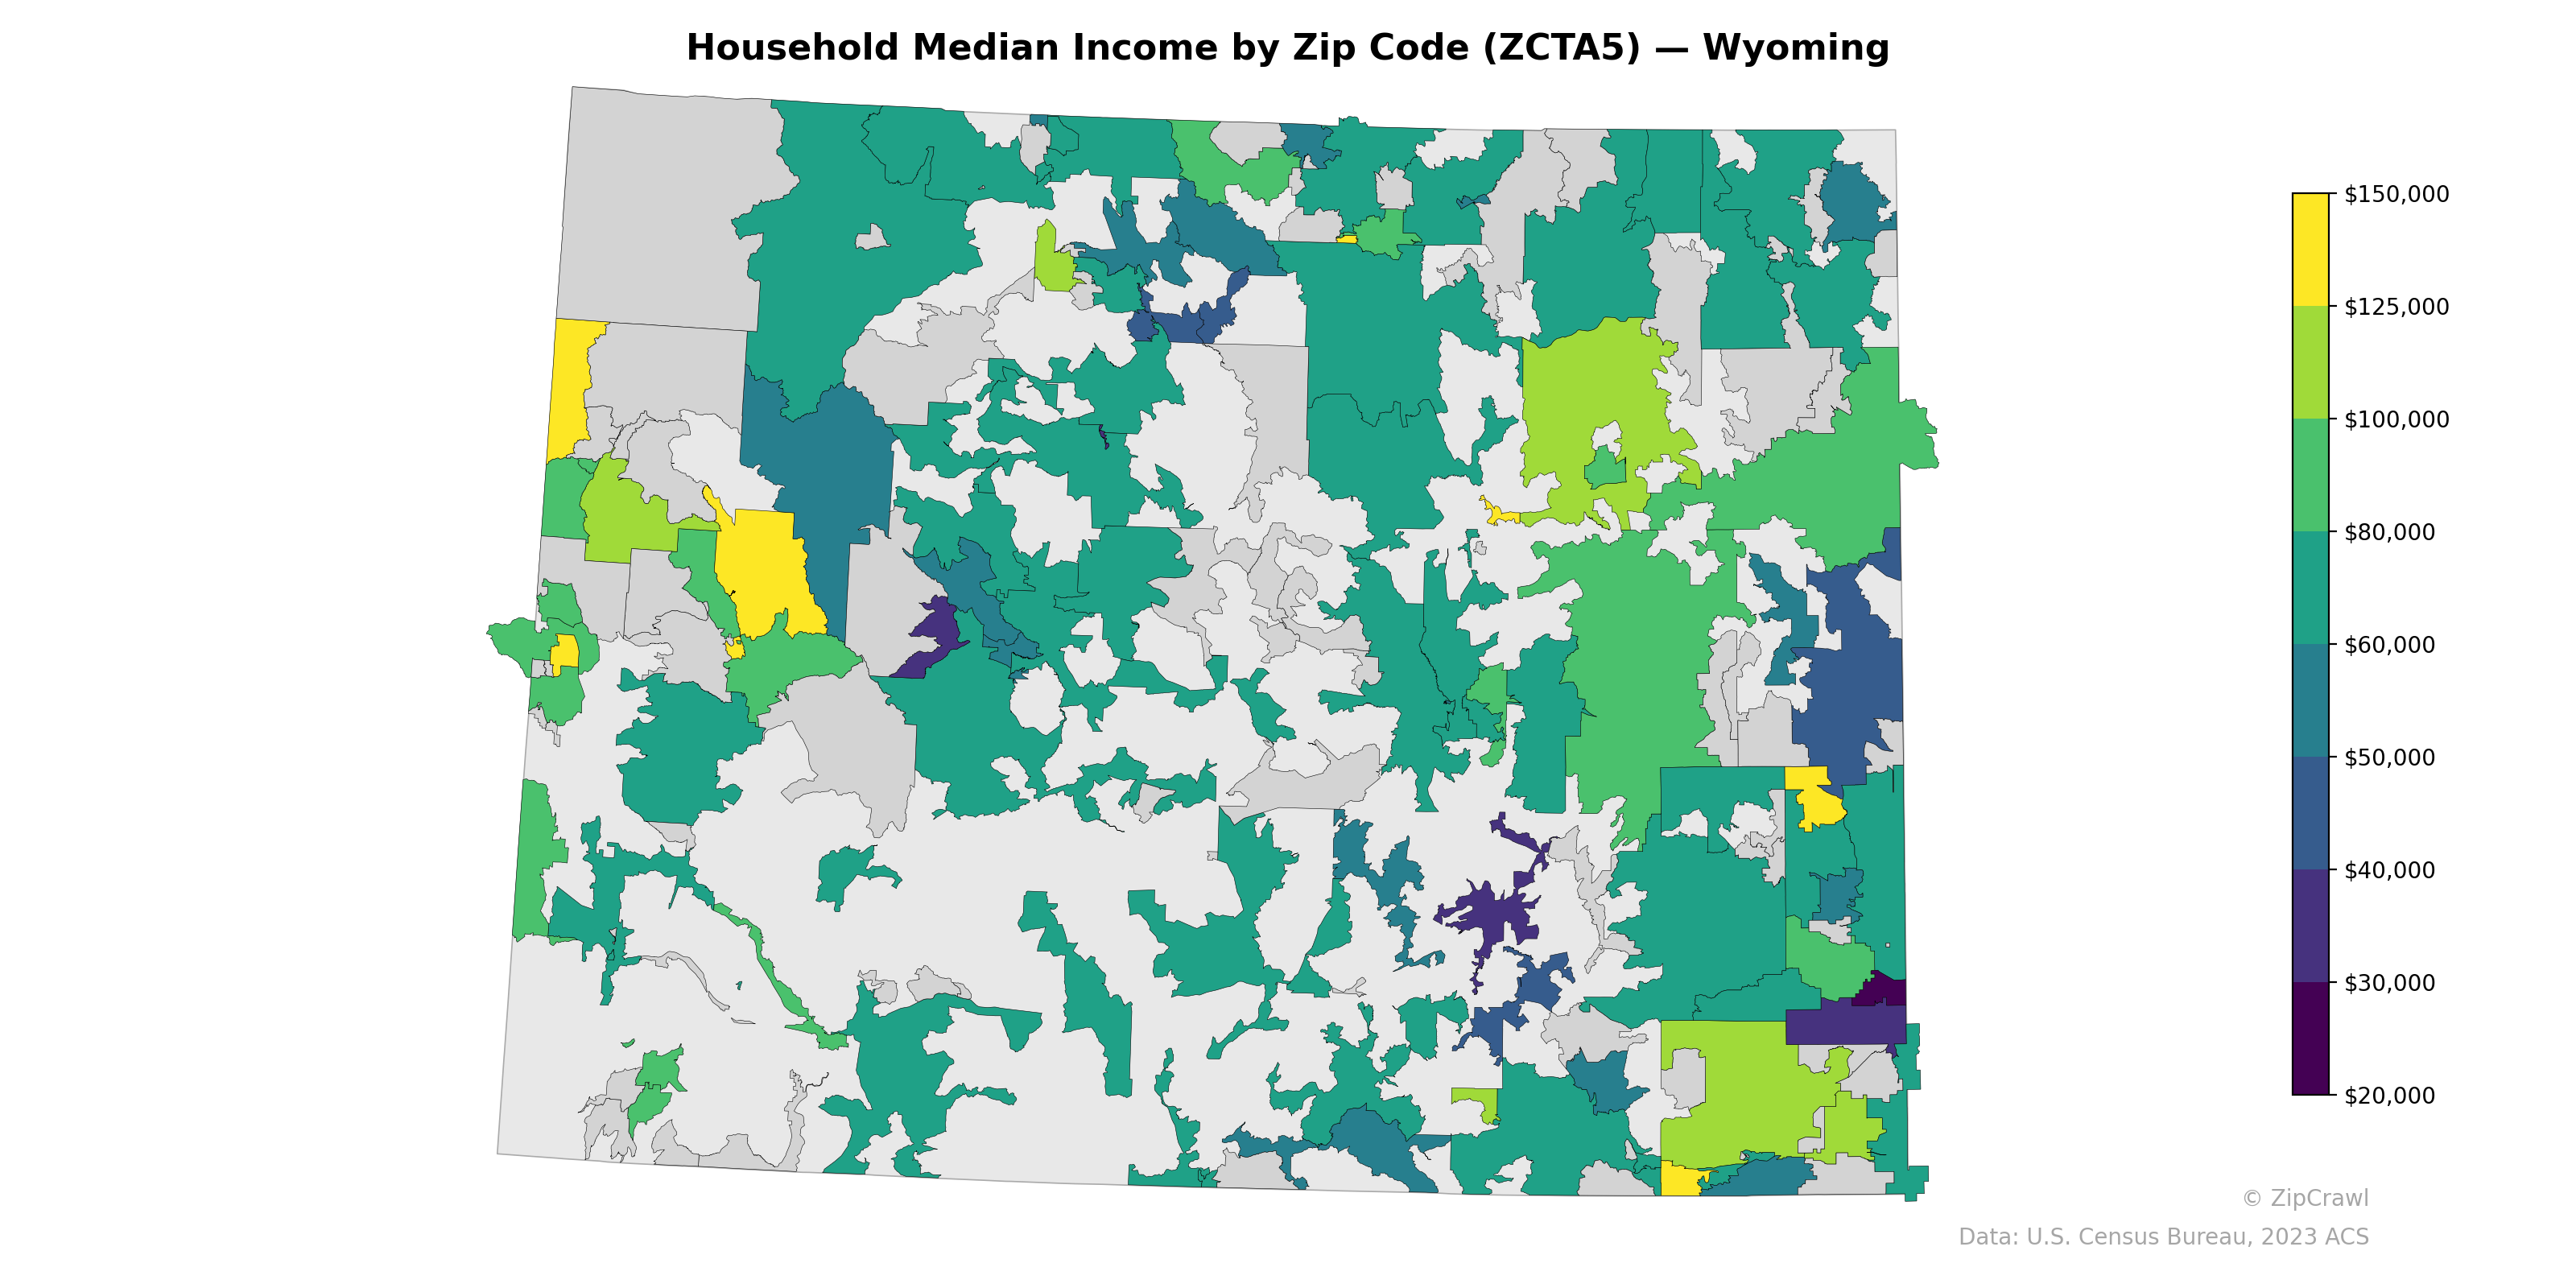
NOTE: Gray indicates insufficient data or a suppressed estimate.
The highest household median incomes in Wyoming concentrate in the northwestern corner near Jackson Hole/Teton County, where zip codes reach $125,000–$150,000+, along with pockets in the western border area near Star Valley and parts of the southwest near Evanston. A pronounced low-income cluster appears in the southeast around Laramie and the southern border region, where several zip codes fall below $30,000, likely reflecting college-town demographics and rural poverty. Central Wyoming displays broadly moderate incomes in the $60,000–$80,000 range, with energy-sector communities like those near Gillette in the northeast and Rock Springs in the southwest showing above-average earnings.
Data: U.S. Census Bureau, 2023 ACS
Explore
- % of Population on Food Stamps or SNAP (Last 12 Months), by Zip Code (ZCTA5) — New York
- Population Non-Hispanic Black % by Zip Code (ZCTA5) — Wyoming
- Married Couple (% of all Households) by Zip Code (ZCTA5) — Vermont
- Population Hispanic % by Zip Code (ZCTA5) — Wyoming
- Population Non-Hispanic Asian % by Zip Code (ZCTA5) — Vermont
- % of Population on Food Stamps or SNAP (Last 12 Months), by Zip Code (ZCTA5) — Vermont
- Population Non-Hispanic White % by Zip Code (ZCTA5) — Wyoming
- U.S. Citizens (% of Population Over 18) by Zip Code (ZCTA5) — Wyoming
- Housing Vacancy Rate by Zip Code (ZCTA5) — Vermont
- Median Age by Zip Code (ZCTA5) — Wyoming
- Married Couple (% of all Households) by County
- Household Average Size by County
- Housing Median Monthly Rent ($), by Zip Code (ZCTA5) — California
- Housing Median Monthly Rent ($), by Zip Code (ZCTA5) — Boston Metro
- Population Non-Hispanic Black % by Zip Code (ZCTA5) — Illinois
- Population Non-Hispanic White % by Zip Code (ZCTA5) — Illinois
- Population Non-Hispanic American Indian % by Zip Code (ZCTA5) — Illinois
- U.S. Citizens (% of Population Over 18) by Zip Code (ZCTA5) — Illinois
- Population Non-Hispanic Asian % by Zip Code (ZCTA5) — New York
- Median Age by Zip Code (ZCTA5) — Illinois
- High School Graduate (% of Over 25) by Zip Code (ZCTA5) — Illinois
- Population Hispanic % by Zip Code (ZCTA5) — Illinois
- % of Households with Broadband Internet, by Zip Code (ZCTA5) — Vermont
- Bachelor's Degree or Higher (% of Over 25) by Zip Code (ZCTA5) — Vermont
- % of Population without Health Insurance, by Zip Code (ZCTA5) — Vermont
- High School Graduate (% of Over 25) by Zip Code (ZCTA5) — Oregon
- Housing Owner-Occupied % of Units, by Zip Code (ZCTA5) — Vermont
- Population Non-Hispanic American Indian % by Zip Code (ZCTA5) — Vermont
- Population Hispanic % by Zip Code (ZCTA5) — Washington D.C.
- High School Graduate (% of Over 25) by Zip Code (ZCTA5) — Vermont
- Household Median Income by Zip Code (ZCTA5) — Iowa
- Household Median Income by Zip Code (ZCTA5) — Indiana
- Household Median Income by Zip Code (ZCTA5) — Ohio
- Household Median Income by Zip Code (ZCTA5) — Maine
- Household Median Income by Zip Code (ZCTA5) — Idaho
- Household Median Income by Zip Code (ZCTA5) — Utah
- Household Median Income by Zip Code (ZCTA5) — Hawaii
- Household Median Income by Zip Code (ZCTA5) — Texas
- Household Median Income by Zip Code (ZCTA5) — Washington
- Household Median Income by Zip Code (ZCTA5) — Minnesota