NOTE: Gray indicates insufficient data or a suppressed estimate.
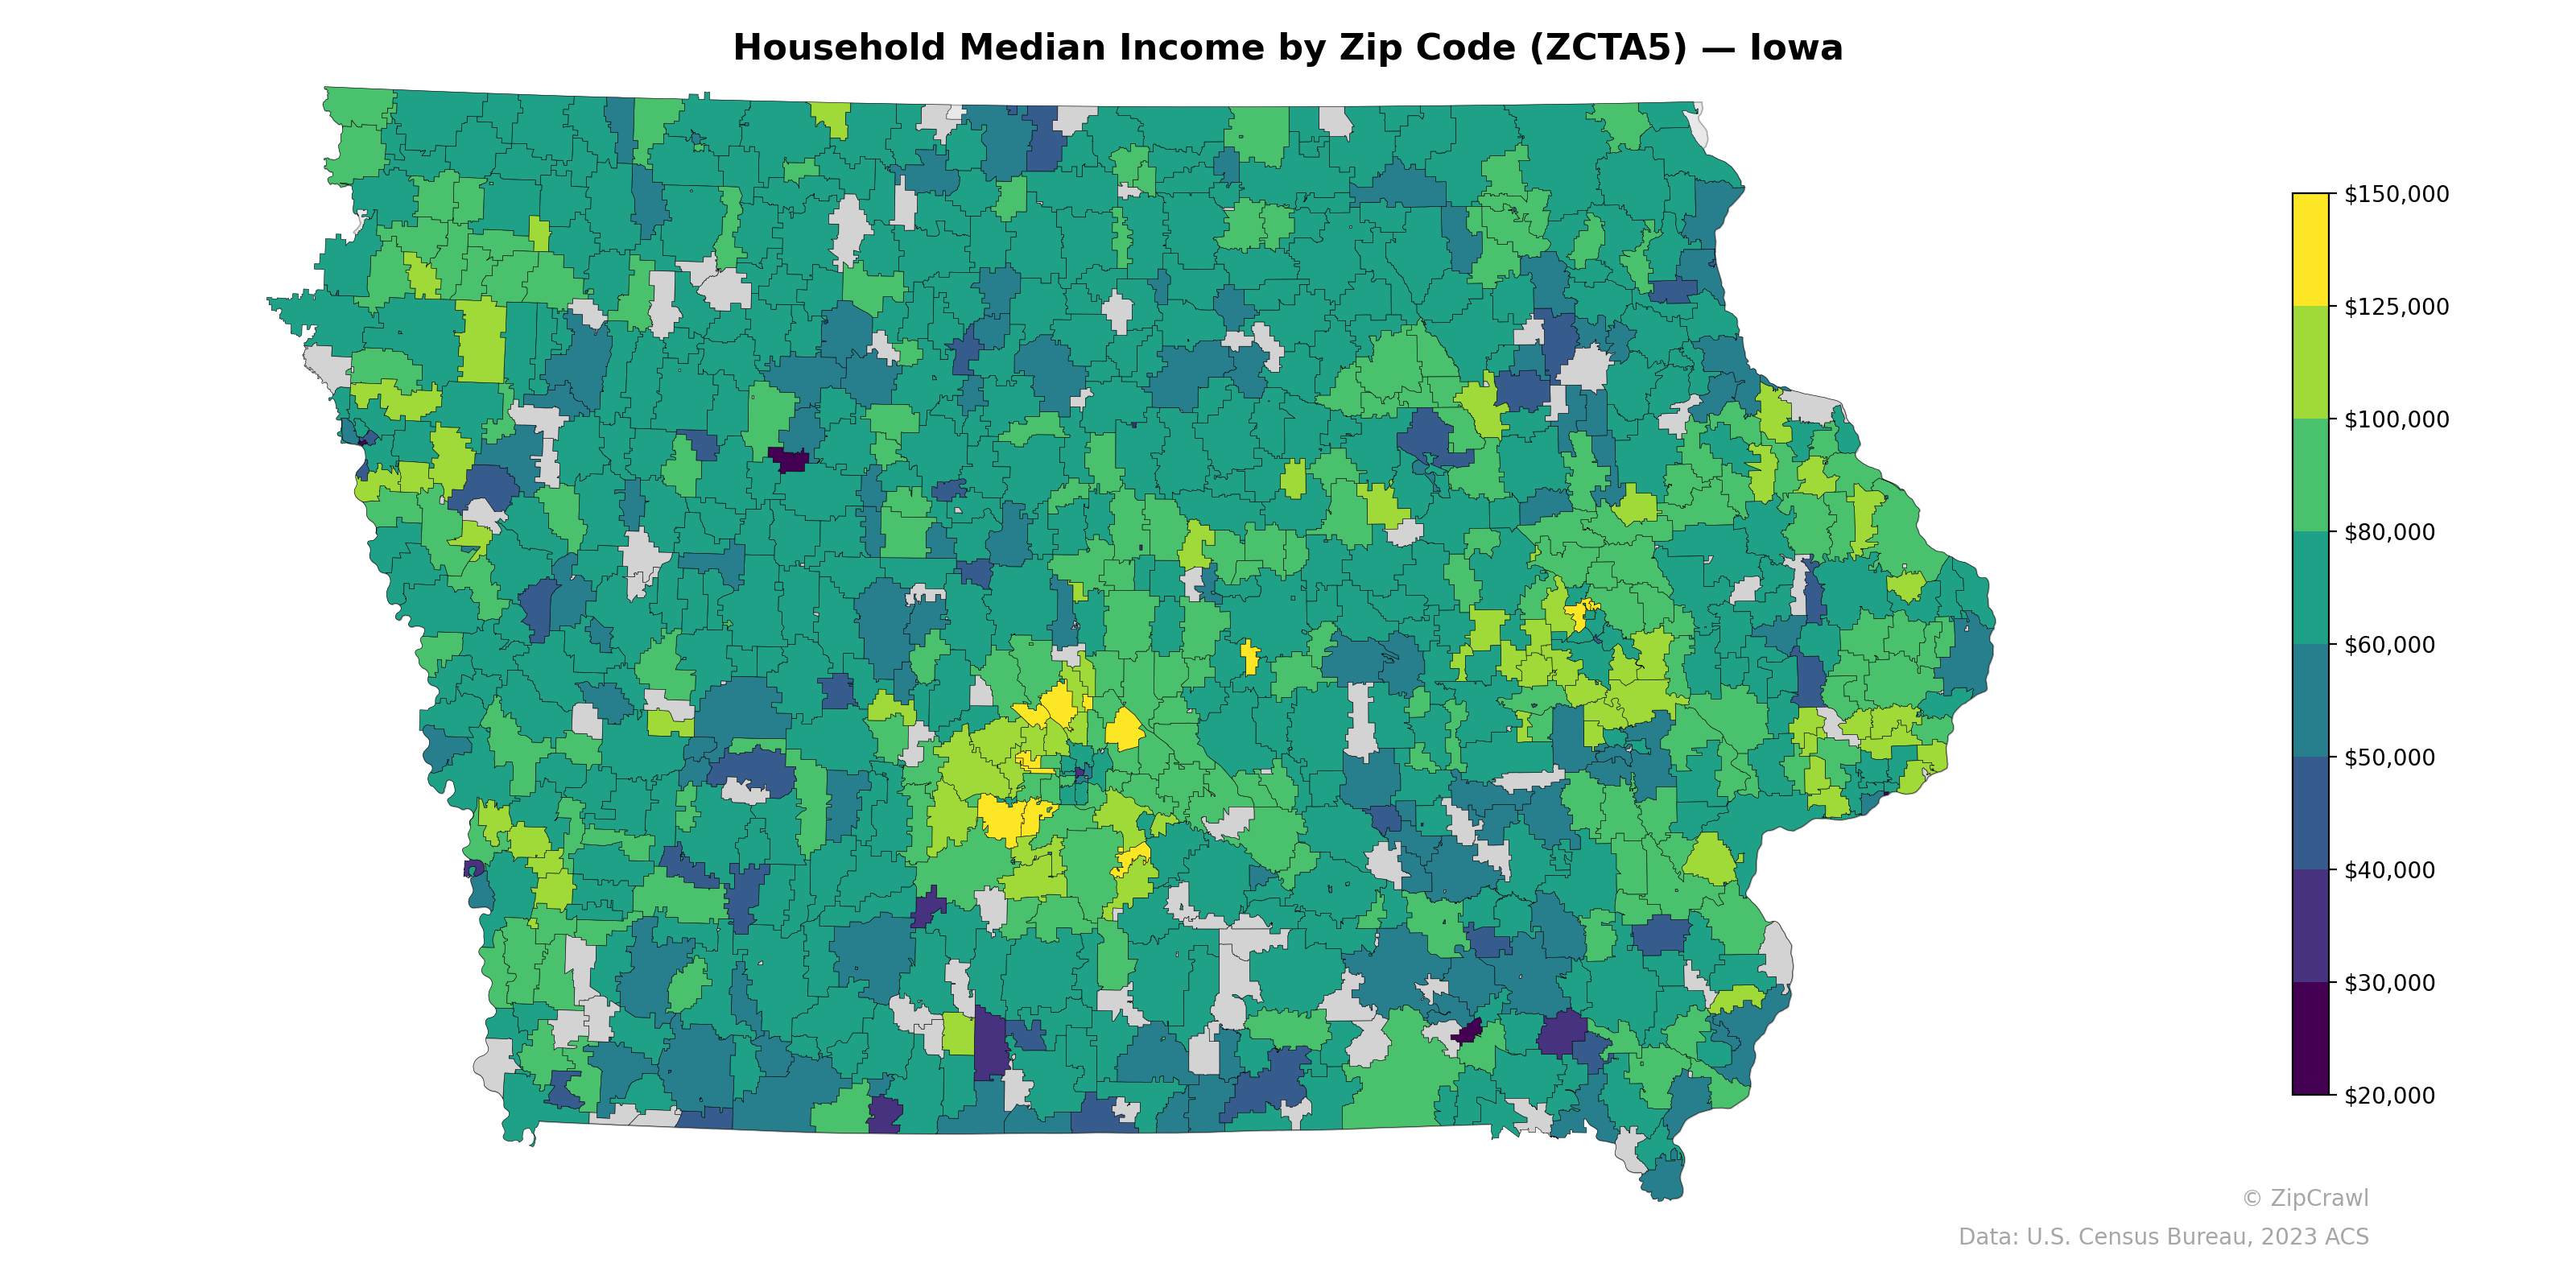
The Des Moines metro area in central Iowa displays the state's most prominent concentration of high-income zip codes, with several exceeding $125,000, likely corresponding to suburban communities like West Des Moines and Ankeny. Northwestern Iowa and parts of the western border exhibit notably lower median incomes, with scattered zip codes falling below $40,000, while the eastern corridor along the Cedar Rapids–Iowa City axis shows a secondary cluster of above-average incomes interspersed with lower-income urban cores. Rural zip codes across southern Iowa consistently trend toward the lower end of the income spectrum compared to the northern tier, which benefits from proximity to agricultural productivity and smaller but economically stable communities.
Data: U.S. Census Bureau, 2023 ACS
Explore
- Population Non-Hispanic Asian % by Zip Code (ZCTA5) — Utah
- Median Age by Zip Code (ZCTA5) — Iowa
- Married Couple (% of all Households) by Zip Code (ZCTA5) — Utah
- % of Population on Food Stamps or SNAP (Last 12 Months), by Zip Code (ZCTA5) — Utah
- Population Non-Hispanic Black % by Zip Code (ZCTA5) — Iowa
- Population Hispanic % by Zip Code (ZCTA5) — Iowa
- Population Non-Hispanic White % by Zip Code (ZCTA5) — Iowa
- U.S. Citizens (% of Population Over 18) by Zip Code (ZCTA5) — Iowa
- Housing Vacancy Rate by Zip Code (ZCTA5) — Utah
- Housing Owner-Occupied Median Value ($), by County
- Housing Median Monthly Rent ($), by Zip Code (ZCTA5) — Georgia
- High School Graduate (% of Over 25) by Zip Code (ZCTA5) — Florida
- Housing Median Monthly Rent ($), by Zip Code (ZCTA5) — Florida
- Population Non-Hispanic White % by Zip Code (ZCTA5) — Florida
- Population Hispanic % by Zip Code (ZCTA5) — Florida
- Median Age by Zip Code (ZCTA5) — Florida
- Population Non-Hispanic Black % by Zip Code (ZCTA5) — Florida
- Population Non-Hispanic Asian % by Zip Code (ZCTA5) — California
- Population Non-Hispanic American Indian % by Zip Code (ZCTA5) — Florida
- U.S. Citizens (% of Population Over 18) by Zip Code (ZCTA5) — Florida
- % of Population on Food Stamps or SNAP (Last 12 Months), by Zip Code (ZCTA5) — California
- Housing Vacancy Rate by Zip Code (ZCTA5) — Connecticut
- Bachelor's Degree or Higher (% of Over 25) by Zip Code (ZCTA5) — Connecticut
- Population Non-Hispanic Asian % by Zip Code (ZCTA5) — Connecticut
- Housing Median Monthly Rent ($), by Zip Code (ZCTA5) — Nevada
- % of Households with Broadband Internet, by Zip Code (ZCTA5) — Connecticut
- Population Non-Hispanic American Indian % by Zip Code (ZCTA5) — Connecticut
- Population Hispanic % by Zip Code (ZCTA5) — Mississippi
- High School Graduate (% of Over 25) by Zip Code (ZCTA5) — Connecticut
- Married Couple (% of all Households) by Zip Code (ZCTA5) — Connecticut
- Household Median Income by Zip Code (ZCTA5) — Indiana
- Household Median Income by Zip Code (ZCTA5) — Idaho
- Household Median Income by Zip Code (ZCTA5) — Maine
- Household Median Income by Zip Code (ZCTA5) — Utah
- Household Median Income by Zip Code (ZCTA5) — Ohio
- Household Median Income by Zip Code (ZCTA5) — Hawaii
- Household Median Income by Zip Code (ZCTA5) — Texas
- Household Median Income by Zip Code (ZCTA5) — Nevada
- Household Median Income by Zip Code (ZCTA5) — Kansas
- Household Median Income by Zip Code (ZCTA5) — Colorado