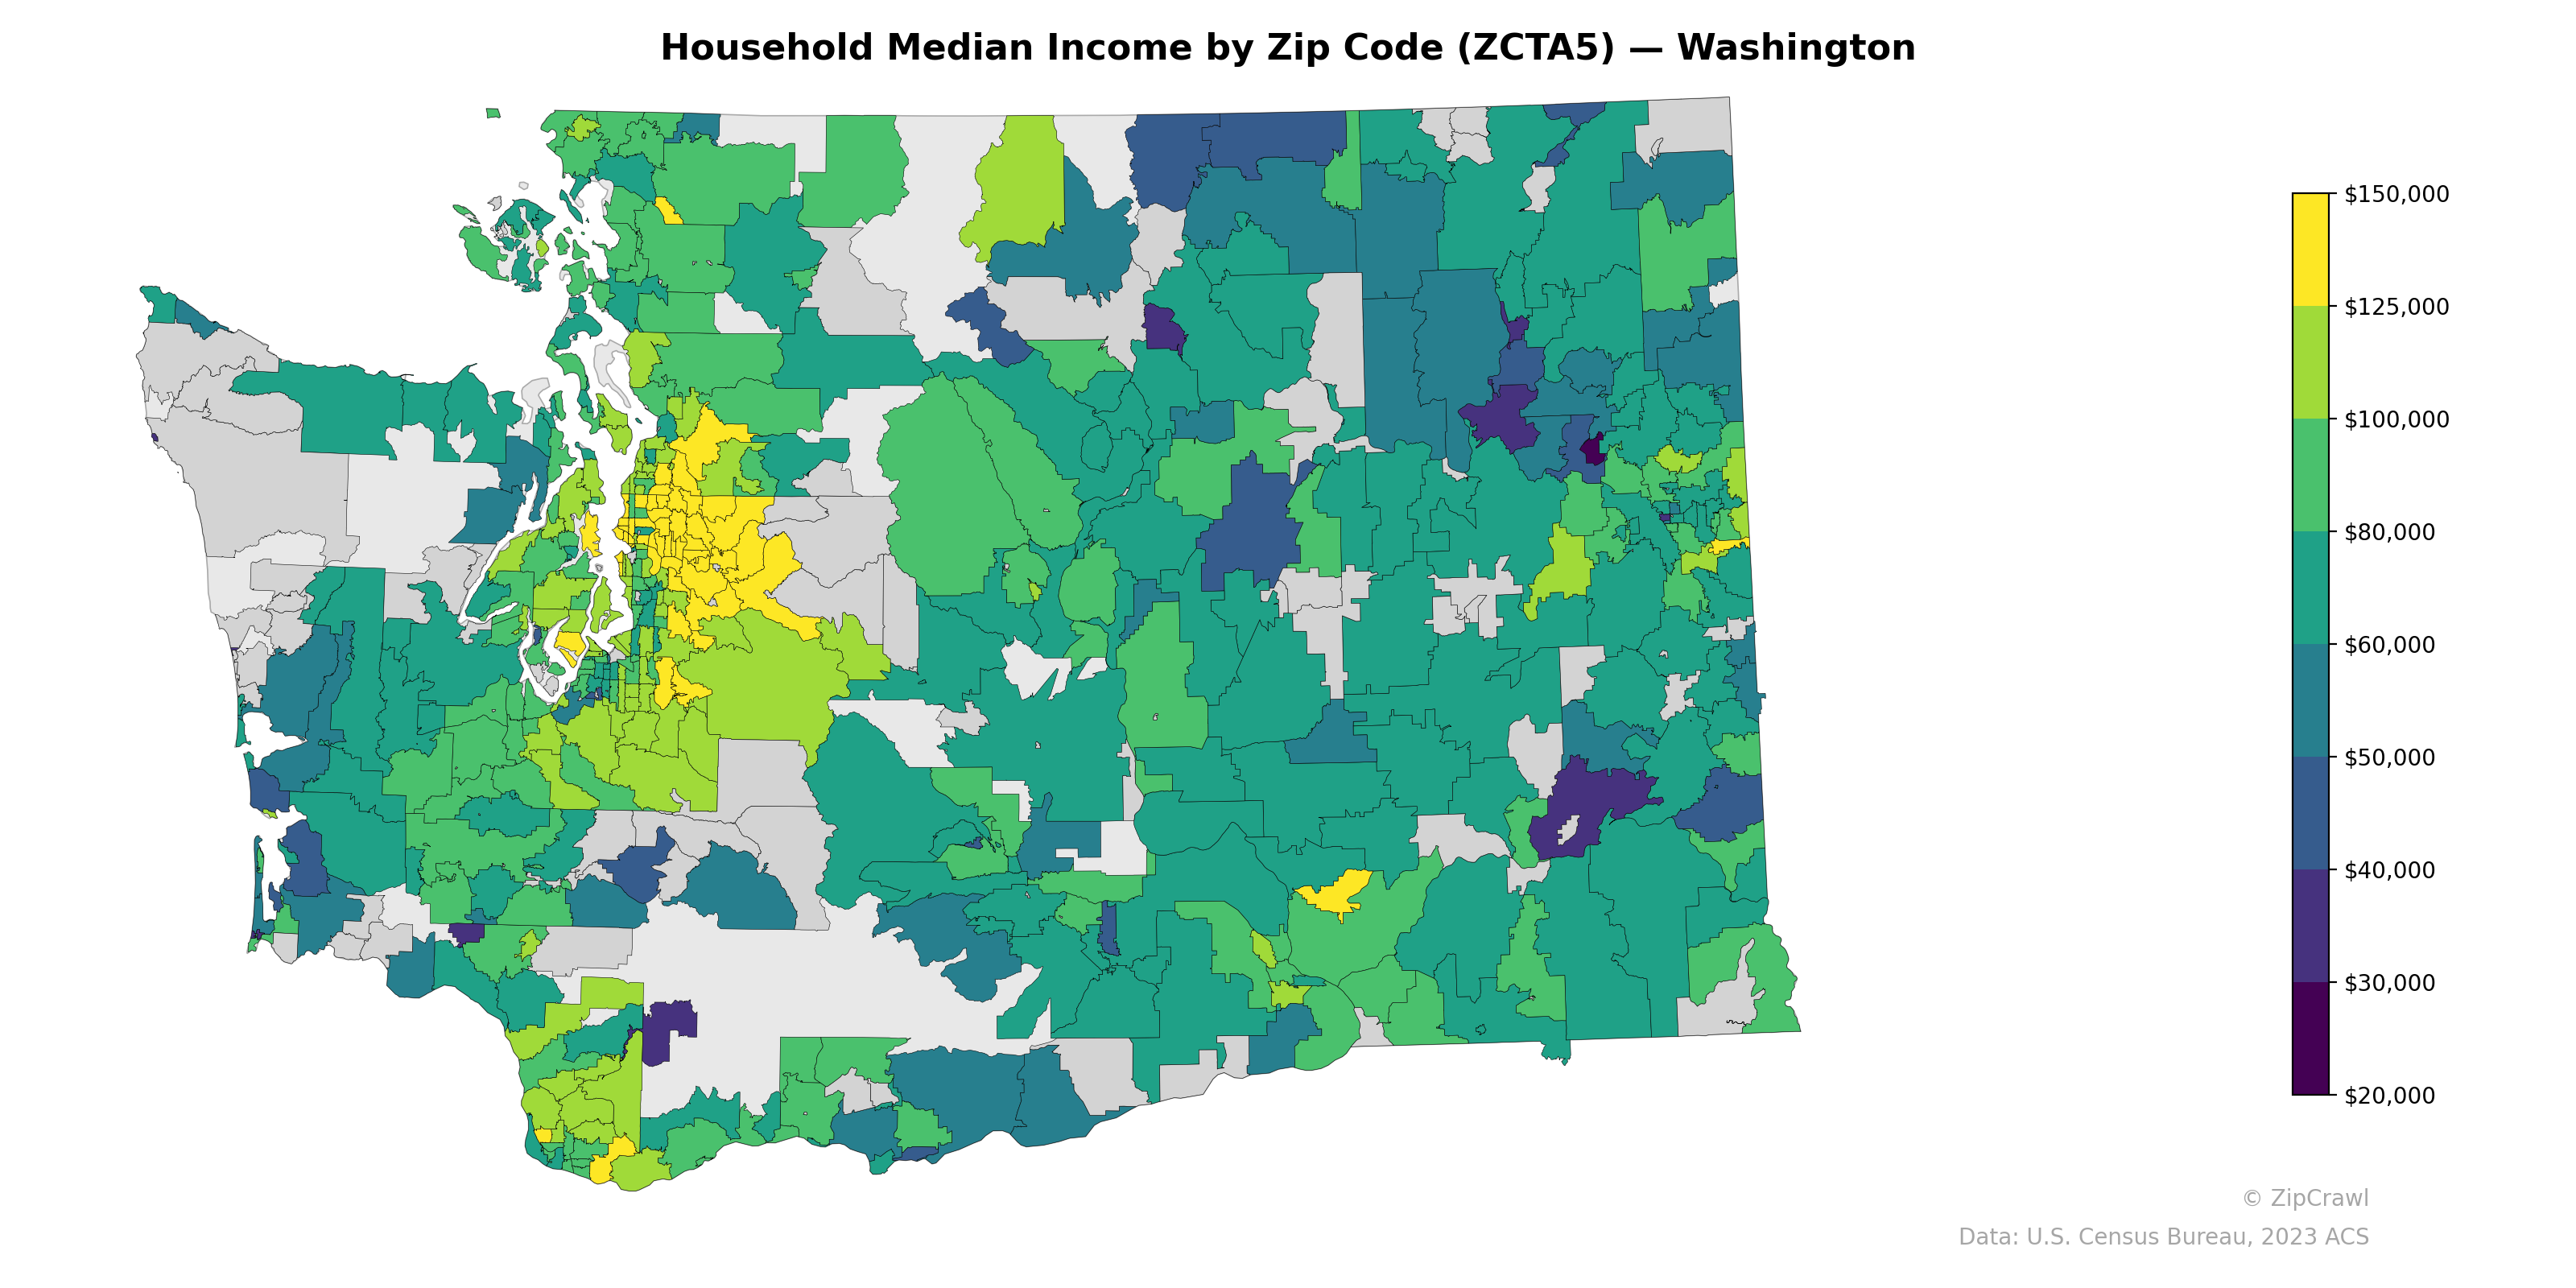
NOTE: Gray indicates insufficient data or a suppressed estimate.
The highest household median incomes, exceeding $125,000, concentrate heavily in the eastside Seattle suburbs and Puget Sound corridor zip codes, particularly in areas corresponding to Bellevue, Sammamish, and Issaquah, forming a distinct yellow-green cluster east of the metro core. Central and southeastern Washington zip codes generally fall in the $50,000–$80,000 range, with notably lower incomes below $30,000 visible in isolated pockets around college towns and tribal lands, including areas near Pullman and the Yakama Reservation. The western coastal and rural southwestern zip codes display moderate incomes in the $50,000–$70,000 range, creating a clear economic gradient between the affluent Puget Sound region and the rest of the state.
Data: U.S. Census Bureau, 2023 ACS
Explore
- Population Hispanic % by Zip Code (ZCTA5) — Los Angeles Metro
- Population Non-Hispanic Asian % by Zip Code (ZCTA5) — Virginia
- Population Non-Hispanic American Indian % by Zip Code (ZCTA5) — Washington
- Population Non-Hispanic White % by Zip Code (ZCTA5) — Washington
- Population Non-Hispanic Black % by Zip Code (ZCTA5) — Washington
- Median Age by Zip Code (ZCTA5) — Washington
- U.S. Citizens (% of Population Over 18) by Zip Code (ZCTA5) — Washington
- High School Graduate (% of Over 25) by Zip Code (ZCTA5) — Washington
- % of Population on Food Stamps or SNAP (Last 12 Months), by Zip Code (ZCTA5) — Virginia
- Population Hispanic % by Zip Code (ZCTA5) — Washington
- % of Households with Broadband Internet, by Zip Code (ZCTA5) — Maine
- Population Hispanic % by County
- Population Non-Hispanic American Indian % by Zip Code (ZCTA5) — Los Angeles Metro
- High School Graduate (% of Over 25) by Zip Code (ZCTA5) — Los Angeles Metro
- Population Non-Hispanic Black % by Zip Code (ZCTA5) — Los Angeles Metro
- Median Age by Zip Code (ZCTA5) — Los Angeles Metro
- U.S. Citizens (% of Population Over 18) by Zip Code (ZCTA5) — Los Angeles Metro
- % of Population on Food Stamps or SNAP (Last 12 Months), by Zip Code (ZCTA5) — New York Metro
- Population Non-Hispanic White % by Zip Code (ZCTA5) — Los Angeles Metro
- Married Couple (% of all Households) by Zip Code (ZCTA5) — Virginia
- Housing % of Units Built Since 2010, by Zip Code (ZCTA5) — Virginia
- Housing Vacancy Rate by Zip Code (ZCTA5) — Virginia
- Bachelor's Degree or Higher (% of Over 25) by Zip Code (ZCTA5) — Virginia
- % of Population without Health Insurance, by Zip Code (ZCTA5) — Virginia
- Population Non-Hispanic American Indian % by Zip Code (ZCTA5) — Virginia
- % of Households with Broadband Internet, by Zip Code (ZCTA5) — Virginia
- Housing Owner-Occupied Median Value ($), by Zip Code (ZCTA5) — Virginia
- Housing Median Monthly Rent ($), by Zip Code (ZCTA5) — Virginia
- Household Average Size by Zip Code (ZCTA5) — Virginia
- High School Graduate (% of Over 25) by Zip Code (ZCTA5) — Virginia
- Household Median Income by Zip Code (ZCTA5) — Washington D.C.
- Household Median Income by Zip Code (ZCTA5) — Washington D.C. Metro
- Household Median Income by Zip Code (ZCTA5) — Houston Metro
- Household Median Income by Zip Code (ZCTA5) — Wyoming
- Household Median Income by Zip Code (ZCTA5) — Iowa
- Household Median Income by Zip Code (ZCTA5) — Indiana
- Household Median Income by Zip Code (ZCTA5) — Oregon
- Household Median Income by Zip Code (ZCTA5) — Ohio
- Household Median Income by Zip Code (ZCTA5) — Idaho
- Household Median Income by Zip Code (ZCTA5) — Utah