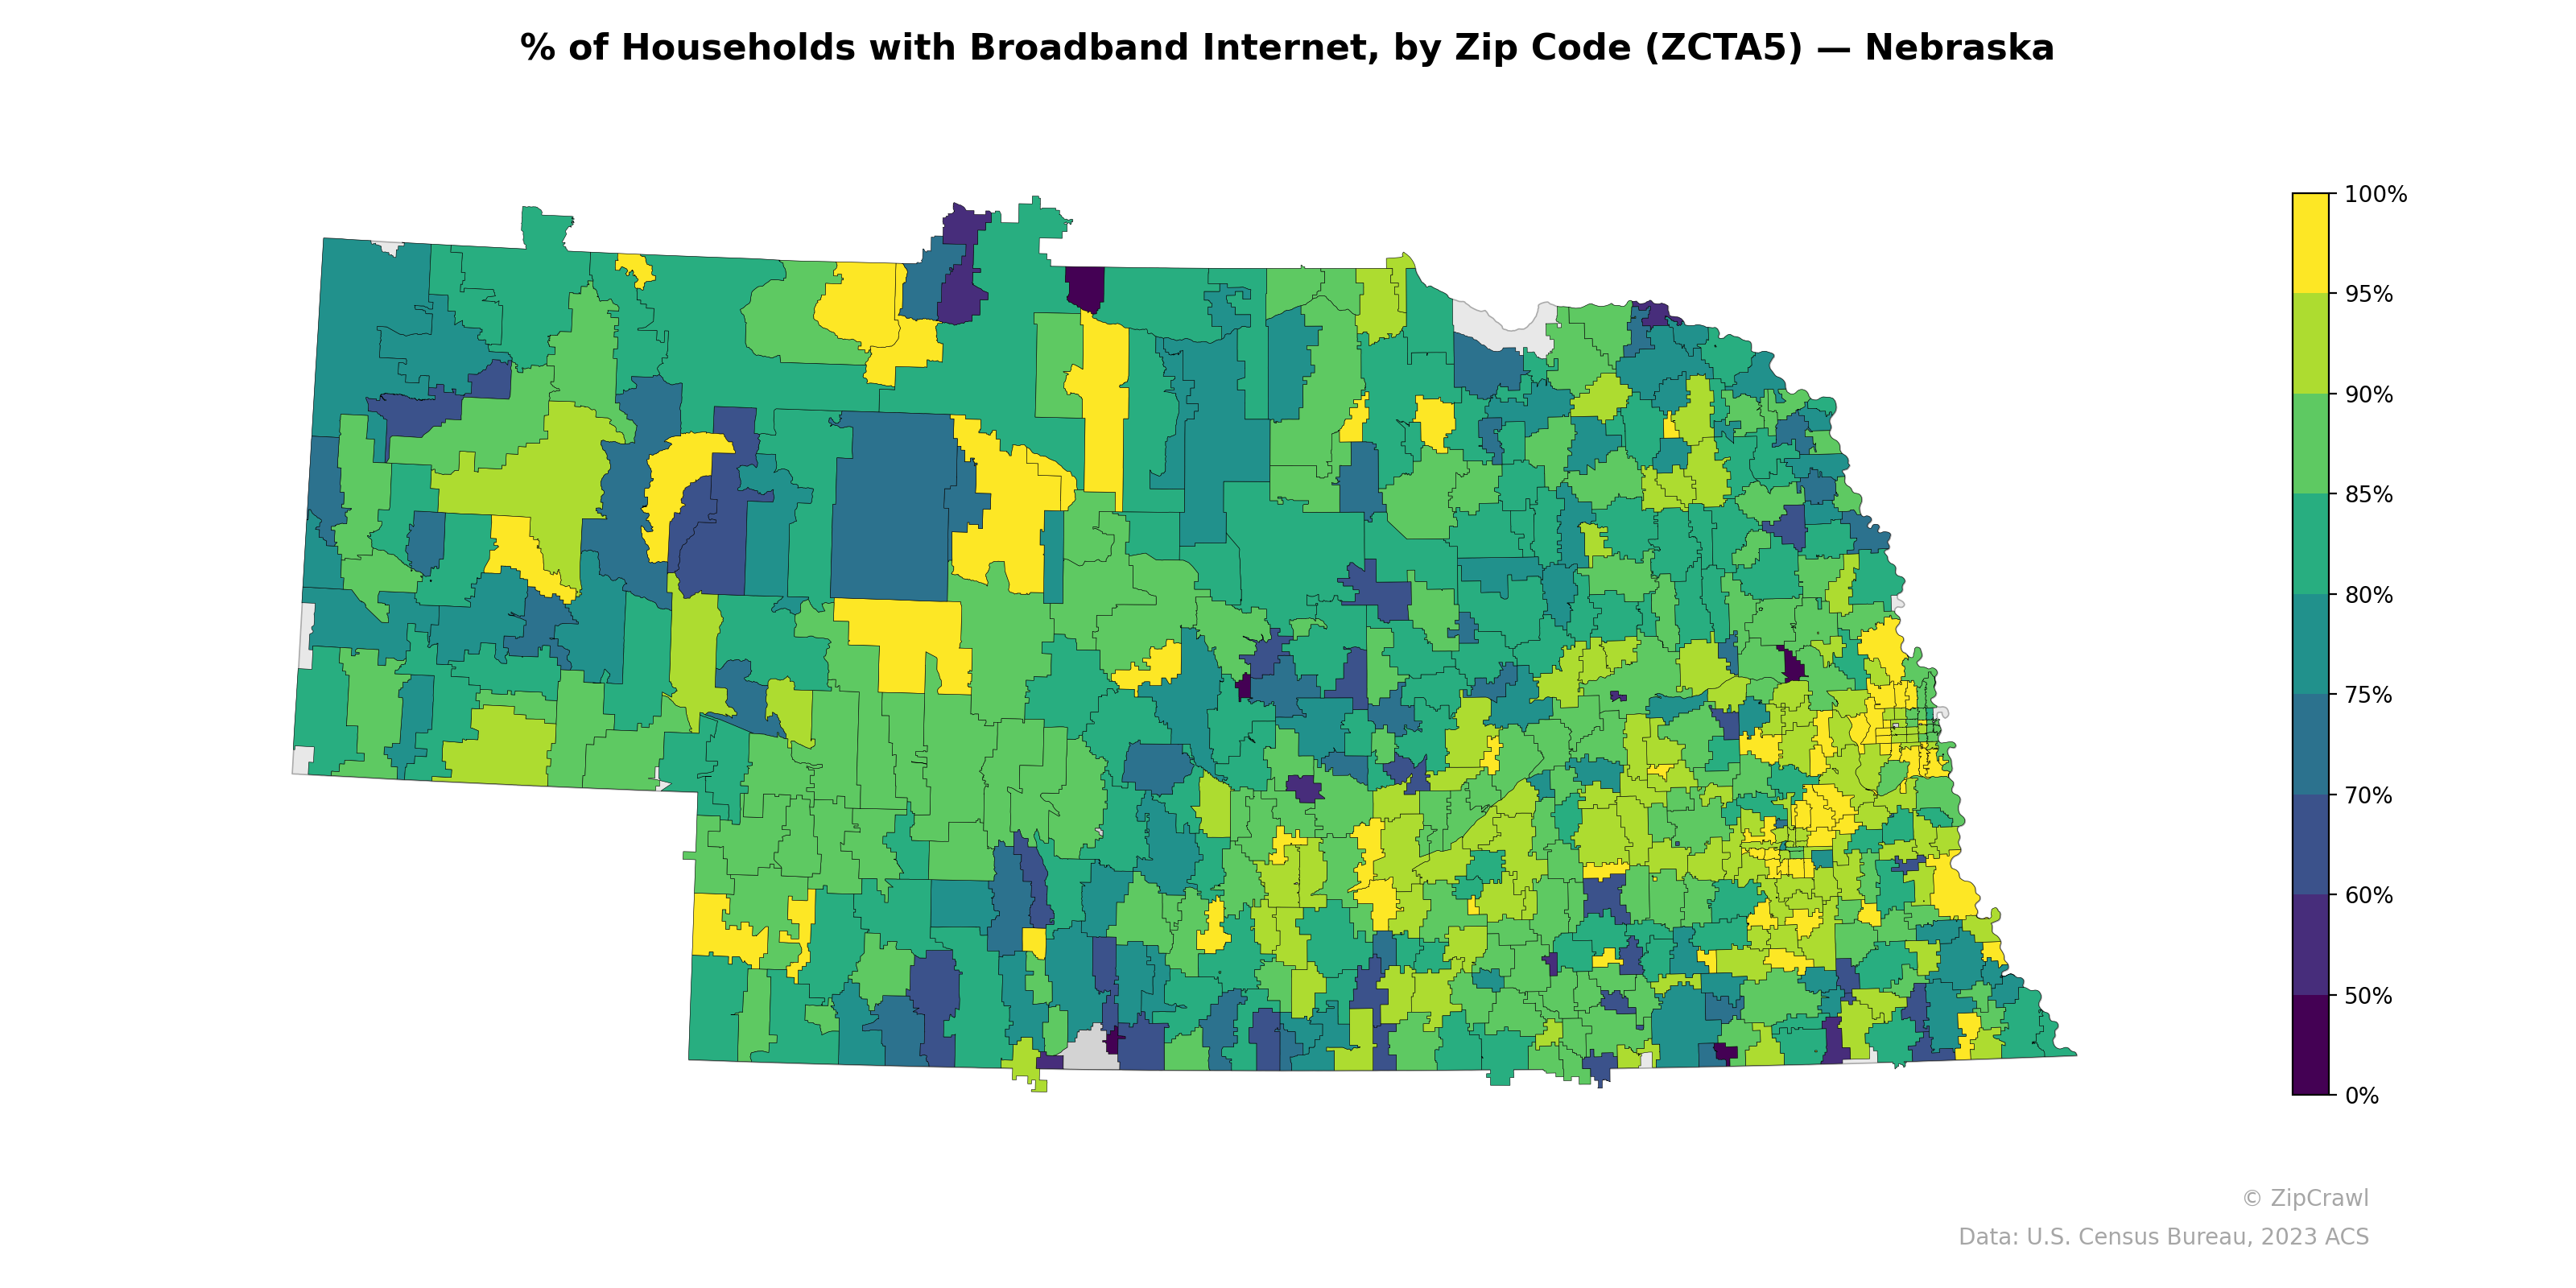
NOTE: Gray indicates insufficient data or a suppressed estimate.
Eastern Nebraska, particularly the Omaha and Lincoln metropolitan areas, exhibits consistently higher broadband adoption rates, with many zip codes reaching 85–95%+, while the western panhandle and Sandhills region display markedly lower penetration, with several zip codes falling below 60%. A notable patchwork pattern emerges in central Nebraska, where high-adoption zip codes (often corresponding to smaller cities like Grand Island, Kearney, and North Platte) sit adjacent to rural areas with significantly lower rates. The southeast corner of the state contains a few zip codes with extremely low broadband penetration near 0–50%, likely reflecting small, isolated communities or areas with limited infrastructure investment.
Data: U.S. Census Bureau, 2023 ACS
Explore
- Housing % of Units Built Since 2010, by Zip Code (ZCTA5) — Florida
- Housing % of Units Built Since 2010, by Zip Code (ZCTA5) — Nebraska
- Population Non-Hispanic American Indian % by Zip Code (ZCTA5) — Nebraska
- High School Graduate (% of Over 25) by Zip Code (ZCTA5) — Nebraska
- % of Population without Health Insurance, by Zip Code (ZCTA5) — Nebraska
- Household Average Size by Zip Code (ZCTA5) — Nebraska
- Housing Owner-Occupied Median Value ($), by Zip Code (ZCTA5) — Nebraska
- Housing Owner-Occupied % of Units, by Zip Code (ZCTA5) — Nebraska
- Housing Median Monthly Rent ($), by Zip Code (ZCTA5) — Nebraska
- Bachelor's Degree or Higher (% of Over 25) by Zip Code (ZCTA5) — Nebraska
- Housing Median Monthly Rent ($), by County
- Household Median Income by Zip Code (ZCTA5) — Washington D.C. Metro
- Housing Vacancy Rate by Zip Code (ZCTA5) — Florida
- Housing Median Monthly Rent ($), by Zip Code (ZCTA5) — Florida
- Housing Owner-Occupied Median Value ($), by Zip Code (ZCTA5) — Florida
- Household Average Size by Zip Code (ZCTA5) — Florida
- Household Median Income by Zip Code (ZCTA5) — Illinois
- Bachelor's Degree or Higher (% of Over 25) by Zip Code (ZCTA5) — Florida
- % of Population without Health Insurance, by Zip Code (ZCTA5) — Florida
- Housing Owner-Occupied % of Units, by Zip Code (ZCTA5) — Florida
- Married Couple (% of all Households) by Zip Code (ZCTA5) — Florida
- % of Population on Food Stamps or SNAP (Last 12 Months), by Zip Code (ZCTA5) — Mississippi
- Housing Owner-Occupied % of Units, by Zip Code (ZCTA5) — Mississippi
- U.S. Citizens (% of Population Over 18) by Zip Code (ZCTA5) — Kansas
- Median Age by Zip Code (ZCTA5) — Idaho
- Housing Owner-Occupied Median Value ($), by Zip Code (ZCTA5) — Mississippi
- Bachelor's Degree or Higher (% of Over 25) by Zip Code (ZCTA5) — Mississippi
- High School Graduate (% of Over 25) by Zip Code (ZCTA5) — Mississippi
- % of Population without Health Insurance, by Zip Code (ZCTA5) — Mississippi
- Population Non-Hispanic American Indian % by Zip Code (ZCTA5) — Mississippi
- % of Households with Broadband Internet, by Zip Code (ZCTA5) — Alaska
- % of Households with Broadband Internet, by Zip Code (ZCTA5) — Nevada
- % of Households with Broadband Internet, by Zip Code (ZCTA5) — Ohio
- % of Households with Broadband Internet, by Zip Code (ZCTA5) — Iowa
- % of Households with Broadband Internet, by Zip Code (ZCTA5) — New York
- % of Households with Broadband Internet, by Zip Code (ZCTA5) — Utah
- % of Households with Broadband Internet, by Zip Code (ZCTA5) — Idaho
- % of Households with Broadband Internet, by Zip Code (ZCTA5) — Oregon
- % of Households with Broadband Internet, by Zip Code (ZCTA5) — Texas
- % of Households with Broadband Internet, by Zip Code (ZCTA5) — Indiana