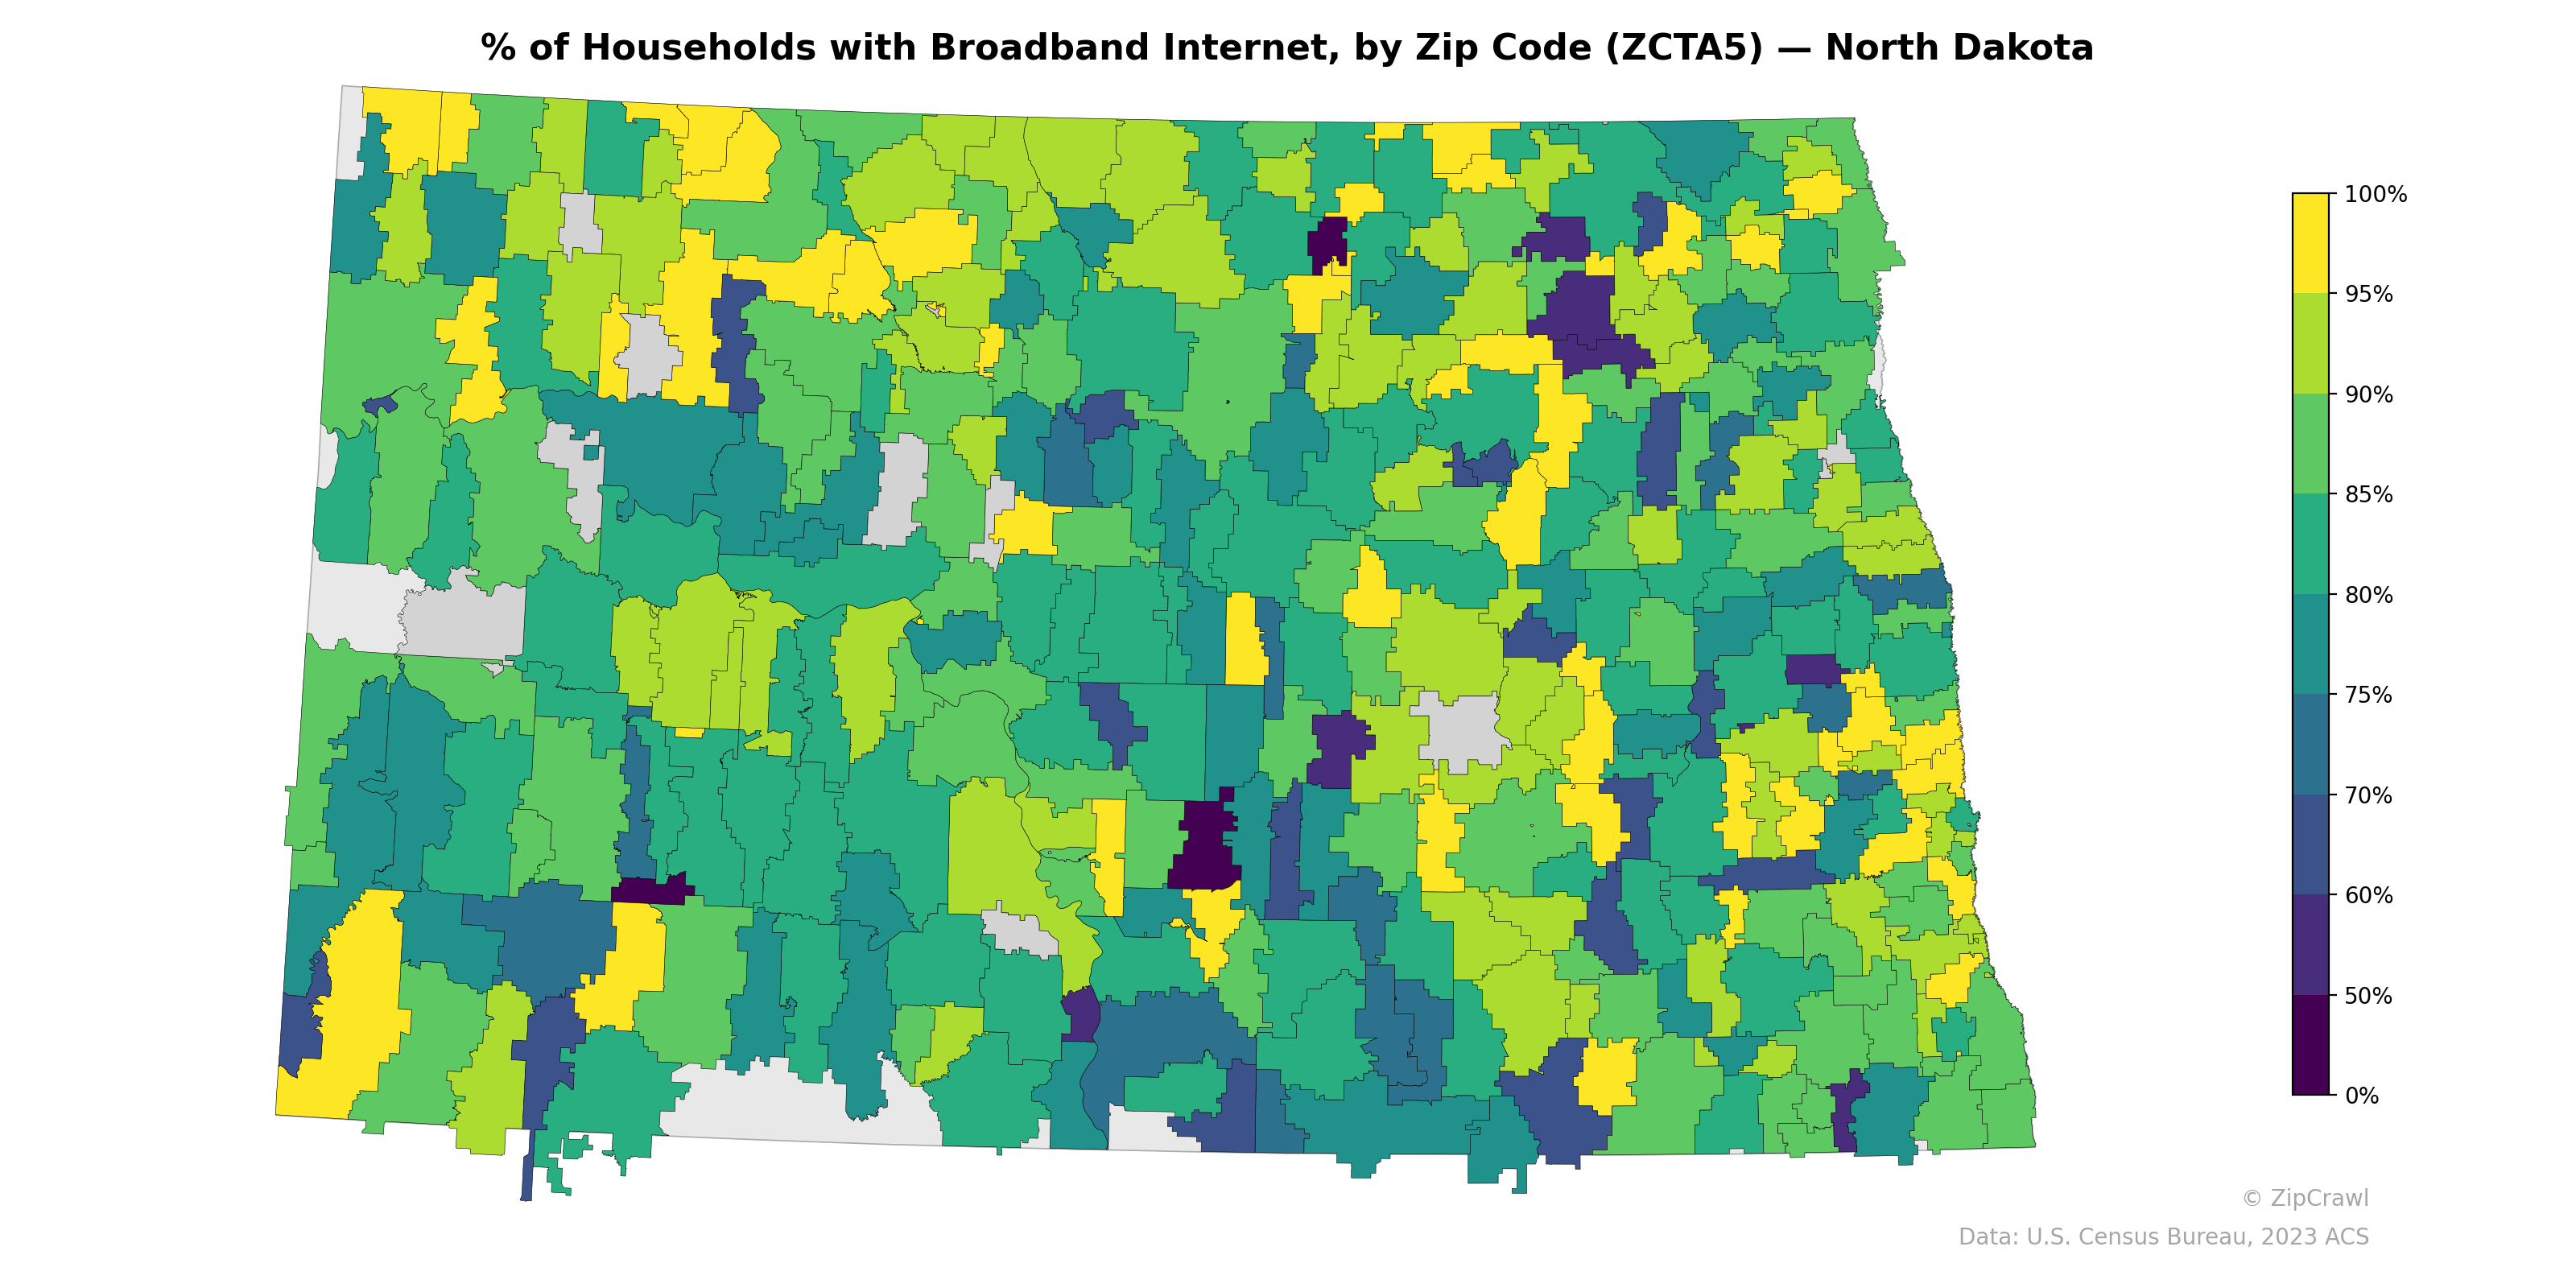
NOTE: Gray indicates insufficient data or a suppressed estimate.
Broadband internet adoption across North Dakota's zip codes varies considerably, with many areas in the 75–90% range but notable pockets of very low connectivity (below 50%) concentrated in several central and south-central zip codes, likely corresponding to rural communities and Native American reservations such as Standing Rock and Fort Berthold. The highest adoption rates, approaching or exceeding 95%, appear clustered around urban centers including the Fargo area in the east, Bismarck-Mandan in the south-central region, and portions of the northwest near Williston. The scattered gray areas indicate zip codes with missing or suppressed data, while the broad swath of moderate green tones across the western half suggests persistently lower broadband penetration in the more sparsely populated ranching and agricultural regions compared to the eastern Red River Valley corridor.
Data: U.S. Census Bureau, 2023 ACS
Explore
- Housing % of Units Built Since 2010, by Zip Code (ZCTA5) — New York
- Population Non-Hispanic American Indian % by Zip Code (ZCTA5) — North Dakota
- High School Graduate (% of Over 25) by Zip Code (ZCTA5) — North Dakota
- % of Population without Health Insurance, by Zip Code (ZCTA5) — North Dakota
- Household Average Size by Zip Code (ZCTA5) — North Dakota
- Housing % of Units Built Since 2010, by Zip Code (ZCTA5) — North Dakota
- Housing Median Monthly Rent ($), by Zip Code (ZCTA5) — North Dakota
- Housing Owner-Occupied Median Value ($), by Zip Code (ZCTA5) — North Dakota
- Housing Owner-Occupied % of Units, by Zip Code (ZCTA5) — North Dakota
- Bachelor's Degree or Higher (% of Over 25) by Zip Code (ZCTA5) — North Dakota
- Household Average Size by County
- Married Couple (% of all Households) by Zip Code (ZCTA5) — New York
- Household Median Income by Zip Code (ZCTA5) — Missouri
- Housing Owner-Occupied Median Value ($), by Zip Code (ZCTA5) — New York
- Housing Median Monthly Rent ($), by Zip Code (ZCTA5) — New York
- % of Population without Health Insurance, by Zip Code (ZCTA5) — New York
- Housing Owner-Occupied % of Units, by Zip Code (ZCTA5) — New York
- Housing Vacancy Rate by Zip Code (ZCTA5) — New York
- Household Median Income by Zip Code (ZCTA5) — Illinois
- Bachelor's Degree or Higher (% of Over 25) by Zip Code (ZCTA5) — New York
- Household Average Size by Zip Code (ZCTA5) — New York
- High School Graduate (% of Over 25) by Zip Code (ZCTA5) — Rhode Island
- Housing Vacancy Rate by Zip Code (ZCTA5) — Alaska
- Housing Vacancy Rate by Zip Code (ZCTA5) — Rhode Island
- Bachelor's Degree or Higher (% of Over 25) by Zip Code (ZCTA5) — Rhode Island
- Median Age by Zip Code (ZCTA5) — Oregon
- Household Average Size by Zip Code (ZCTA5) — Rhode Island
- Population Non-Hispanic Black % by Zip Code (ZCTA5) — North Dakota
- Population Non-Hispanic American Indian % by Zip Code (ZCTA5) — Rhode Island
- Married Couple (% of all Households) by Zip Code (ZCTA5) — Rhode Island
- % of Households with Broadband Internet, by Zip Code (ZCTA5) — South Dakota
- % of Households with Broadband Internet, by Zip Code (ZCTA5) — North Carolina
- % of Households with Broadband Internet, by Zip Code (ZCTA5) — Ohio
- % of Households with Broadband Internet, by Zip Code (ZCTA5) — Iowa
- % of Households with Broadband Internet, by Zip Code (ZCTA5) — Nevada
- % of Households with Broadband Internet, by Zip Code (ZCTA5) — Utah
- % of Households with Broadband Internet, by Zip Code (ZCTA5) — Idaho
- % of Households with Broadband Internet, by Zip Code (ZCTA5) — Minnesota
- % of Households with Broadband Internet, by Zip Code (ZCTA5) — Oregon
- % of Households with Broadband Internet, by Zip Code (ZCTA5) — Texas