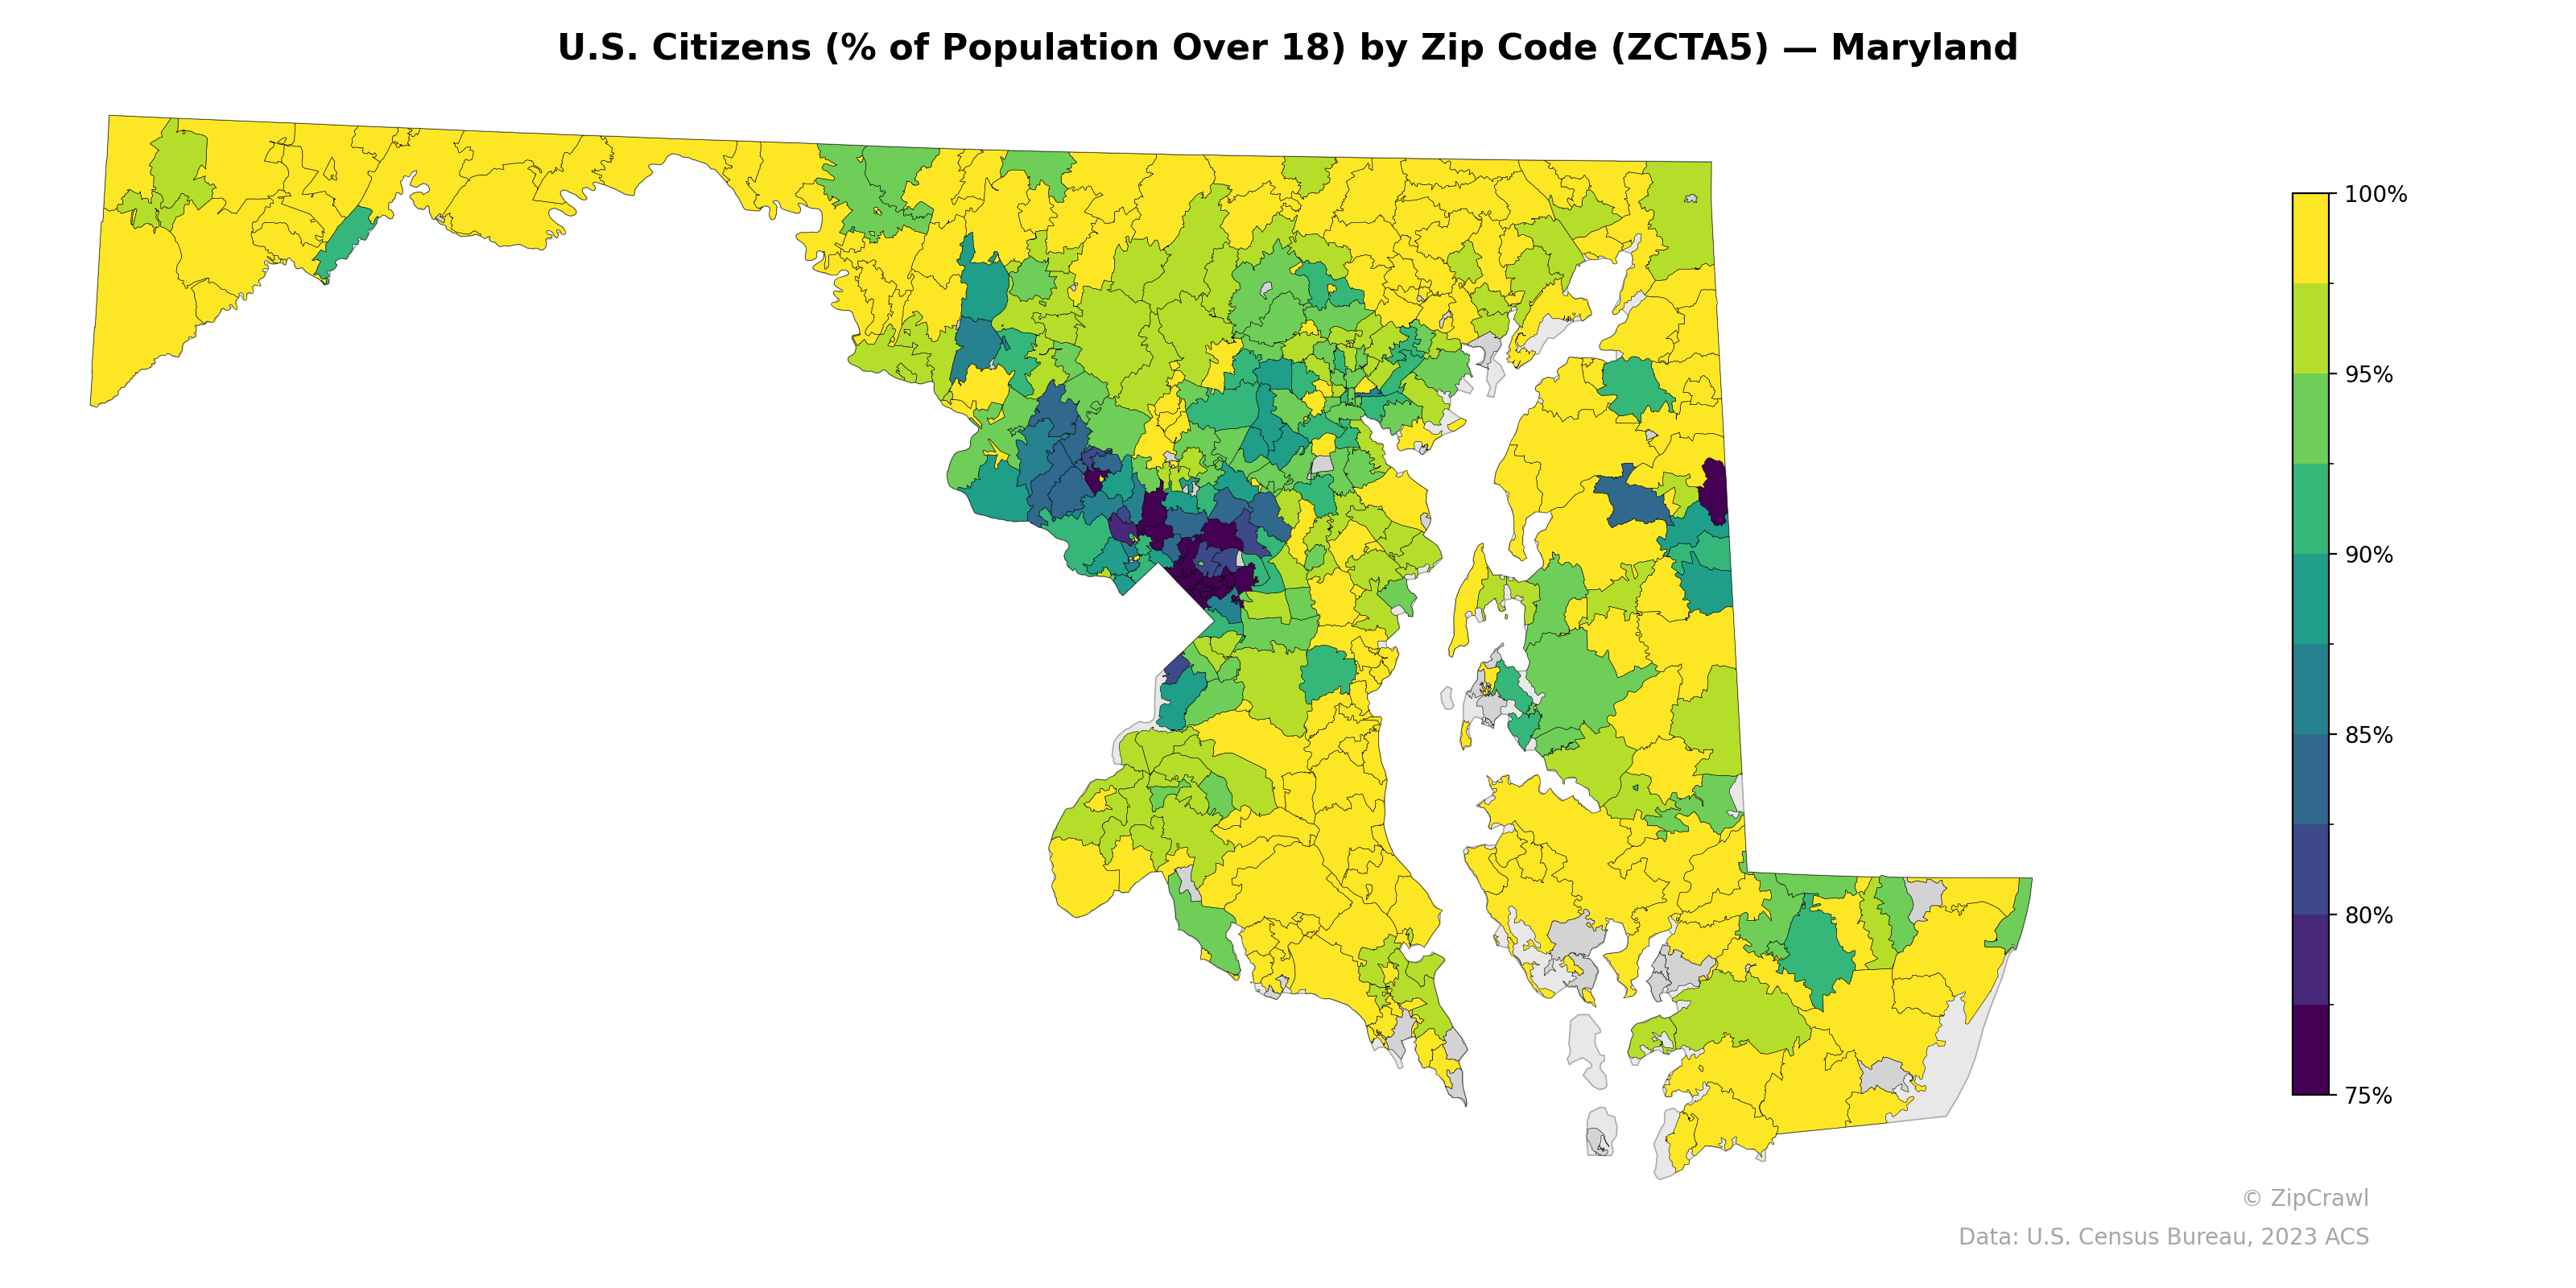
NOTE: Gray indicates insufficient data or a suppressed estimate.
The lowest U.S. citizenship rates among adults concentrate heavily in the Washington, D.C. suburban corridor of Montgomery and Prince George's counties, where several zip codes fall below 80%, reflecting the region's large immigrant communities. A secondary cluster of lower citizenship rates appears on the lower Eastern Shore near Salisbury, likely tied to agricultural workforce demographics. By contrast, western Maryland, the upper Eastern Shore, and southern Maryland's rural zip codes consistently exceed 95%, highlighting a sharp urban-suburban versus rural divide in foreign-born population concentration.
Data: U.S. Census Bureau, 2023 ACS
Explore
- Married Couple (% of all Households) by Zip Code (ZCTA5) — Los Angeles Metro
- Population Non-Hispanic Black % by Zip Code (ZCTA5) — Maryland
- Median Age by Zip Code (ZCTA5) — Maryland
- Population Non-Hispanic American Indian % by Zip Code (ZCTA5) — Maryland
- Population Non-Hispanic Asian % by Zip Code (ZCTA5) — Missouri
- Population Non-Hispanic White % by Zip Code (ZCTA5) — Maryland
- % of Population on Food Stamps or SNAP (Last 12 Months), by Zip Code (ZCTA5) — Missouri
- Household Median Income by Zip Code (ZCTA5) — Maryland
- Population Hispanic % by Zip Code (ZCTA5) — Maryland
- High School Graduate (% of Over 25) by Zip Code (ZCTA5) — Maryland
- Bachelor's Degree or Higher (% of Over 25) by Zip Code (ZCTA5) — Alaska
- Population Non-Hispanic Black % by County
- Housing Vacancy Rate by Zip Code (ZCTA5) — Los Angeles Metro
- Household Average Size by Zip Code (ZCTA5) — Los Angeles Metro
- Housing Owner-Occupied % of Units, by Zip Code (ZCTA5) — Los Angeles Metro
- Housing Median Monthly Rent ($), by Zip Code (ZCTA5) — Los Angeles Metro
- % of Households with Broadband Internet, by Zip Code (ZCTA5) — Los Angeles Metro
- Housing Owner-Occupied Median Value ($), by Zip Code (ZCTA5) — Los Angeles Metro
- Bachelor's Degree or Higher (% of Over 25) by Zip Code (ZCTA5) — Los Angeles Metro
- % of Population without Health Insurance, by Zip Code (ZCTA5) — Los Angeles Metro
- Housing % of Units Built Since 2010, by Zip Code (ZCTA5) — Los Angeles Metro
- Housing % of Units Built Since 2010, by Zip Code (ZCTA5) — Tennessee
- Housing Owner-Occupied Median Value ($), by Zip Code (ZCTA5) — Tennessee
- Household Average Size by Zip Code (ZCTA5) — Tennessee
- High School Graduate (% of Over 25) by Zip Code (ZCTA5) — Tennessee
- Population Non-Hispanic American Indian % by Zip Code (ZCTA5) — Tennessee
- % of Population without Health Insurance, by Zip Code (ZCTA5) — Tennessee
- Housing Owner-Occupied % of Units, by Zip Code (ZCTA5) — Tennessee
- Housing Median Monthly Rent ($), by Zip Code (ZCTA5) — Tennessee
- Bachelor's Degree or Higher (% of Over 25) by Zip Code (ZCTA5) — Tennessee
- U.S. Citizens (% of Population Over 18) by Zip Code (ZCTA5) — Maine
- U.S. Citizens (% of Population Over 18) by Zip Code (ZCTA5) — Portland Metro
- U.S. Citizens (% of Population Over 18) by Zip Code (ZCTA5) — Utah
- U.S. Citizens (% of Population Over 18) by Zip Code (ZCTA5) — Ohio
- U.S. Citizens (% of Population Over 18) by Zip Code (ZCTA5) — Rhode Island
- U.S. Citizens (% of Population Over 18) by Zip Code (ZCTA5) — Oregon
- U.S. Citizens (% of Population Over 18) by Zip Code (ZCTA5) — Iowa
- U.S. Citizens (% of Population Over 18) by Zip Code (ZCTA5) — Montana
- U.S. Citizens (% of Population Over 18) by Zip Code (ZCTA5) — Texas
- U.S. Citizens (% of Population Over 18) by Zip Code (ZCTA5) — Idaho