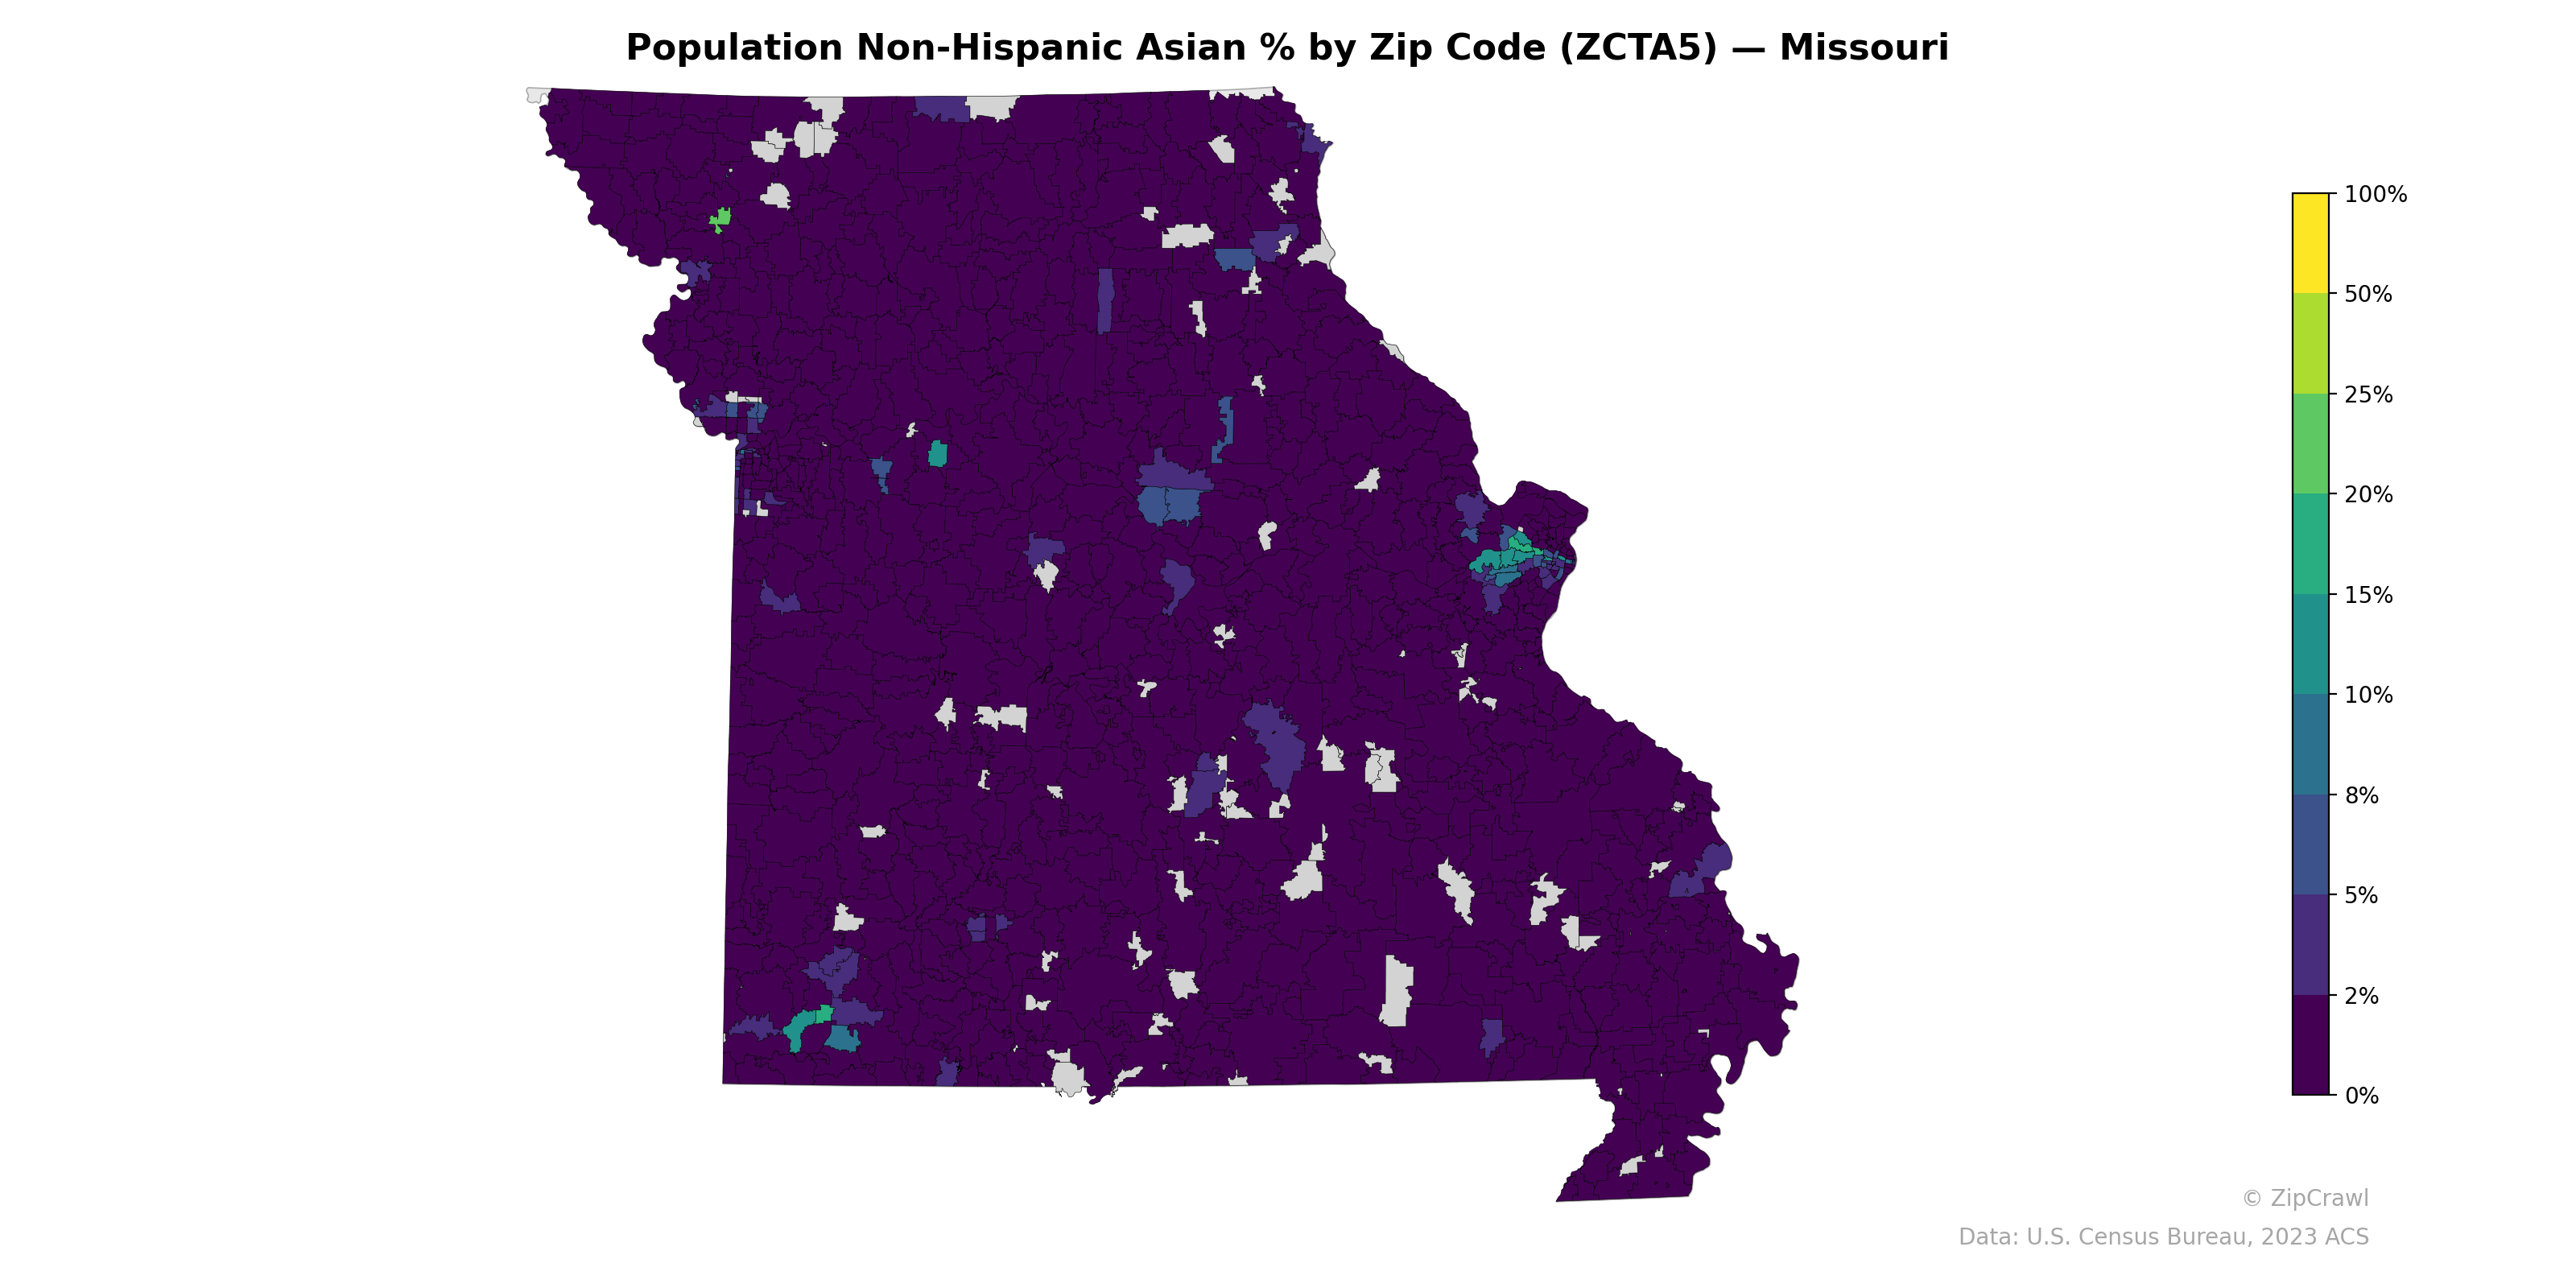
NOTE: Gray indicates insufficient data or a suppressed estimate.
The highest concentrations of Non-Hispanic Asian residents in Missouri cluster around the St. Louis metropolitan area on the eastern border, where several zip codes reach approximately 10–15%, and to a lesser extent in the Kansas City metro area along the western border. University-affiliated communities, notably Columbia in the central part of the state and areas near Maryville in the northwest, display elevated percentages relative to their surrounding rural regions. The vast majority of rural zip codes across southern and northern Missouri register near 0%, creating a stark urban-rural divide in Asian population distribution.
Data: U.S. Census Bureau, 2023 ACS
Explore
- Married Couple (% of all Households) by Zip Code (ZCTA5) — Los Angeles Metro
- Population Non-Hispanic Black % by Zip Code (ZCTA5) — Maryland
- % of Population on Food Stamps or SNAP (Last 12 Months), by Zip Code (ZCTA5) — Missouri
- Population Hispanic % by Zip Code (ZCTA5) — Maryland
- U.S. Citizens (% of Population Over 18) by Zip Code (ZCTA5) — Maryland
- Population Non-Hispanic White % by Zip Code (ZCTA5) — Maryland
- Population Non-Hispanic American Indian % by Zip Code (ZCTA5) — Maryland
- Household Median Income by Zip Code (ZCTA5) — Maryland
- Median Age by Zip Code (ZCTA5) — Maryland
- High School Graduate (% of Over 25) by Zip Code (ZCTA5) — Maryland
- Population Non-Hispanic American Indian % by Zip Code (ZCTA5) — Alaska
- Population Non-Hispanic Black % by County
- Housing Vacancy Rate by Zip Code (ZCTA5) — Los Angeles Metro
- Housing % of Units Built Since 2010, by Zip Code (ZCTA5) — Los Angeles Metro
- Household Average Size by Zip Code (ZCTA5) — Los Angeles Metro
- Housing Owner-Occupied % of Units, by Zip Code (ZCTA5) — Los Angeles Metro
- % of Population without Health Insurance, by Zip Code (ZCTA5) — Los Angeles Metro
- Housing Owner-Occupied Median Value ($), by Zip Code (ZCTA5) — Los Angeles Metro
- Bachelor's Degree or Higher (% of Over 25) by Zip Code (ZCTA5) — Los Angeles Metro
- % of Households with Broadband Internet, by Zip Code (ZCTA5) — Los Angeles Metro
- Housing Median Monthly Rent ($), by Zip Code (ZCTA5) — Los Angeles Metro
- Housing Median Monthly Rent ($), by Zip Code (ZCTA5) — Tennessee
- Housing Owner-Occupied % of Units, by Zip Code (ZCTA5) — Tennessee
- Housing % of Units Built Since 2010, by Zip Code (ZCTA5) — Tennessee
- Population Non-Hispanic American Indian % by Zip Code (ZCTA5) — Tennessee
- Population Non-Hispanic Black % by Zip Code (ZCTA5) — Tennessee
- % of Households with Broadband Internet, by Zip Code (ZCTA5) — Tennessee
- % of Population without Health Insurance, by Zip Code (ZCTA5) — Tennessee
- Housing Owner-Occupied Median Value ($), by Zip Code (ZCTA5) — Tennessee
- High School Graduate (% of Over 25) by Zip Code (ZCTA5) — Tennessee
- Population Non-Hispanic Asian % by Zip Code (ZCTA5) — Mississippi
- Population Non-Hispanic Asian % by Zip Code (ZCTA5) — Michigan
- Population Non-Hispanic Asian % by Zip Code (ZCTA5) — Maine
- Population Non-Hispanic Asian % by Zip Code (ZCTA5) — Iowa
- Population Non-Hispanic Asian % by Zip Code (ZCTA5) — Ohio
- Population Non-Hispanic Asian % by Zip Code (ZCTA5) — Utah
- Population Non-Hispanic Asian % by Zip Code (ZCTA5) — Minnesota
- Population Non-Hispanic Asian % by Zip Code (ZCTA5) — Montana
- Population Non-Hispanic Asian % by Zip Code (ZCTA5) — Texas
- Population Non-Hispanic Asian % by Zip Code (ZCTA5) — Oregon