NOTE: Gray indicates insufficient data or a suppressed estimate.
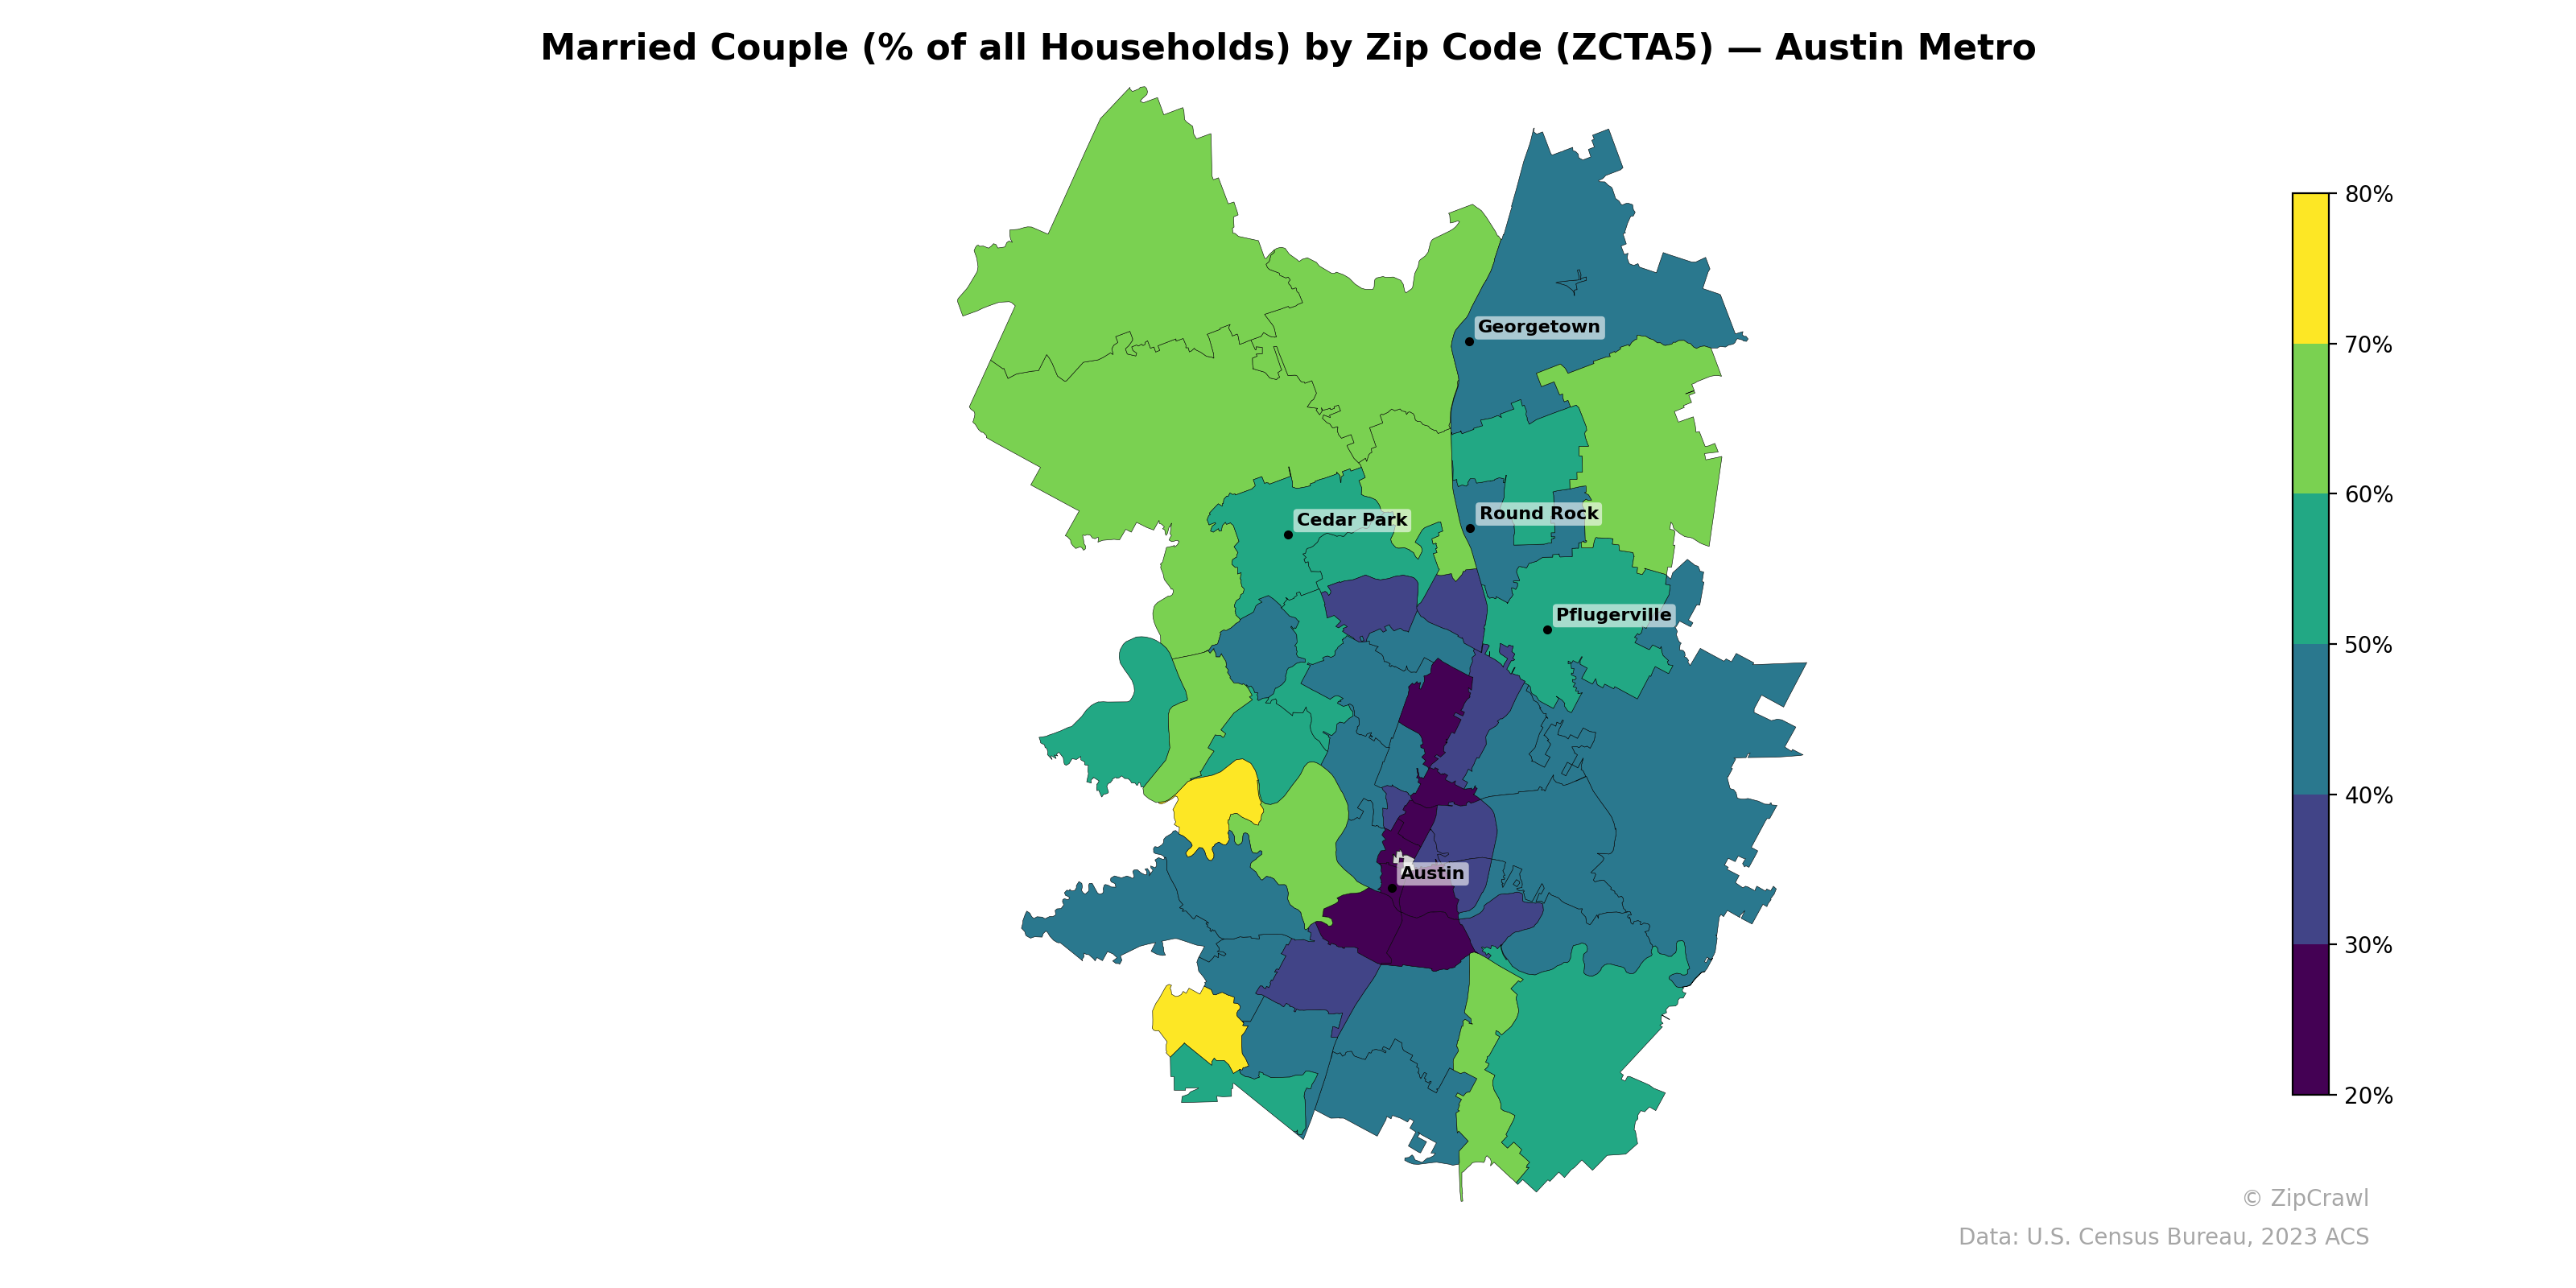
Married-couple households concentrate most heavily in the outer suburban ring, with zip codes in the Georgetown, Cedar Park, and northwest corridor consistently exceeding 60%, while several areas reach above 70–80%. Central Austin zip codes form a distinct low-percentage cluster, dropping below 30% in the urban core near downtown and the university area. A notable east-west contrast is also visible, as western suburban zip codes generally shade lighter (higher marriage rates) than their eastern counterparts at similar distances from the city center.
Data: U.S. Census Bureau, 2023 ACS
Explore
- Population Non-Hispanic Black % by Zip Code (ZCTA5) — Texas
- Household Average Size by Zip Code (ZCTA5) — Austin Metro
- Housing Owner-Occupied % of Units, by Zip Code (ZCTA5) — Austin Metro
- % of Population without Health Insurance, by Zip Code (ZCTA5) — Austin Metro
- % of Households with Broadband Internet, by Zip Code (ZCTA5) — Austin Metro
- Housing Median Monthly Rent ($), by Zip Code (ZCTA5) — Austin Metro
- Housing Owner-Occupied Median Value ($), by Zip Code (ZCTA5) — Austin Metro
- Bachelor's Degree or Higher (% of Over 25) by Zip Code (ZCTA5) — Austin Metro
- Housing % of Units Built Since 2010, by Zip Code (ZCTA5) — Austin Metro
- Housing Vacancy Rate by Zip Code (ZCTA5) — Austin Metro
- High School Graduate (% of Over 25) by County
- U.S. Citizens (% of Population Over 18) by Zip Code (ZCTA5) — Texas
- Population Non-Hispanic White % by Zip Code (ZCTA5) — Texas
- Population Non-Hispanic Asian % by Zip Code (ZCTA5) — Chicago Metro
- % of Population on Food Stamps or SNAP (Last 12 Months), by Zip Code (ZCTA5) — Chicago Metro
- Household Median Income by Zip Code (ZCTA5) — Texas
- Population Hispanic % by Zip Code (ZCTA5) — Texas
- Population Non-Hispanic American Indian % by Zip Code (ZCTA5) — Texas
- Median Age by Zip Code (ZCTA5) — Texas
- High School Graduate (% of Over 25) by Zip Code (ZCTA5) — Texas
- % of Population without Health Insurance, by Zip Code (ZCTA5) — Baltimore Metro
- % of Households with Broadband Internet, by Zip Code (ZCTA5) — Baltimore Metro
- Housing Owner-Occupied % of Units, by Zip Code (ZCTA5) — Baltimore Metro
- % of Population on Food Stamps or SNAP (Last 12 Months), by Zip Code (ZCTA5) — Charlotte Metro
- Population Non-Hispanic Asian % by Zip Code (ZCTA5) — Charlotte Metro
- U.S. Citizens (% of Population Over 18) by Zip Code (ZCTA5) — Baltimore Metro
- High School Graduate (% of Over 25) by Zip Code (ZCTA5) — Baltimore Metro
- Bachelor's Degree or Higher (% of Over 25) by Zip Code (ZCTA5) — Baltimore Metro
- Population Non-Hispanic American Indian % by Zip Code (ZCTA5) — Baltimore Metro
- Population Non-Hispanic Black % by Zip Code (ZCTA5) — Baltimore Metro
- Married Couple (% of all Households) by Zip Code (ZCTA5) — Houston Metro
- Married Couple (% of all Households) by Zip Code (ZCTA5) — Miami Metro
- Married Couple (% of all Households) by Zip Code (ZCTA5) — Dallas Metro
- Married Couple (% of all Households) by Zip Code (ZCTA5) — Boston Metro
- Married Couple (% of all Households) by Zip Code (ZCTA5) — Detroit Metro
- Married Couple (% of all Households) by Zip Code (ZCTA5) — Tampa Metro
- Married Couple (% of all Households) by Zip Code (ZCTA5) — Atlanta Metro
- Married Couple (% of all Households) by Zip Code (ZCTA5) — Chicago Metro
- Married Couple (% of all Households) by Zip Code (ZCTA5) — Denver Metro
- Married Couple (% of all Households) by Zip Code (ZCTA5) — Seattle Metro