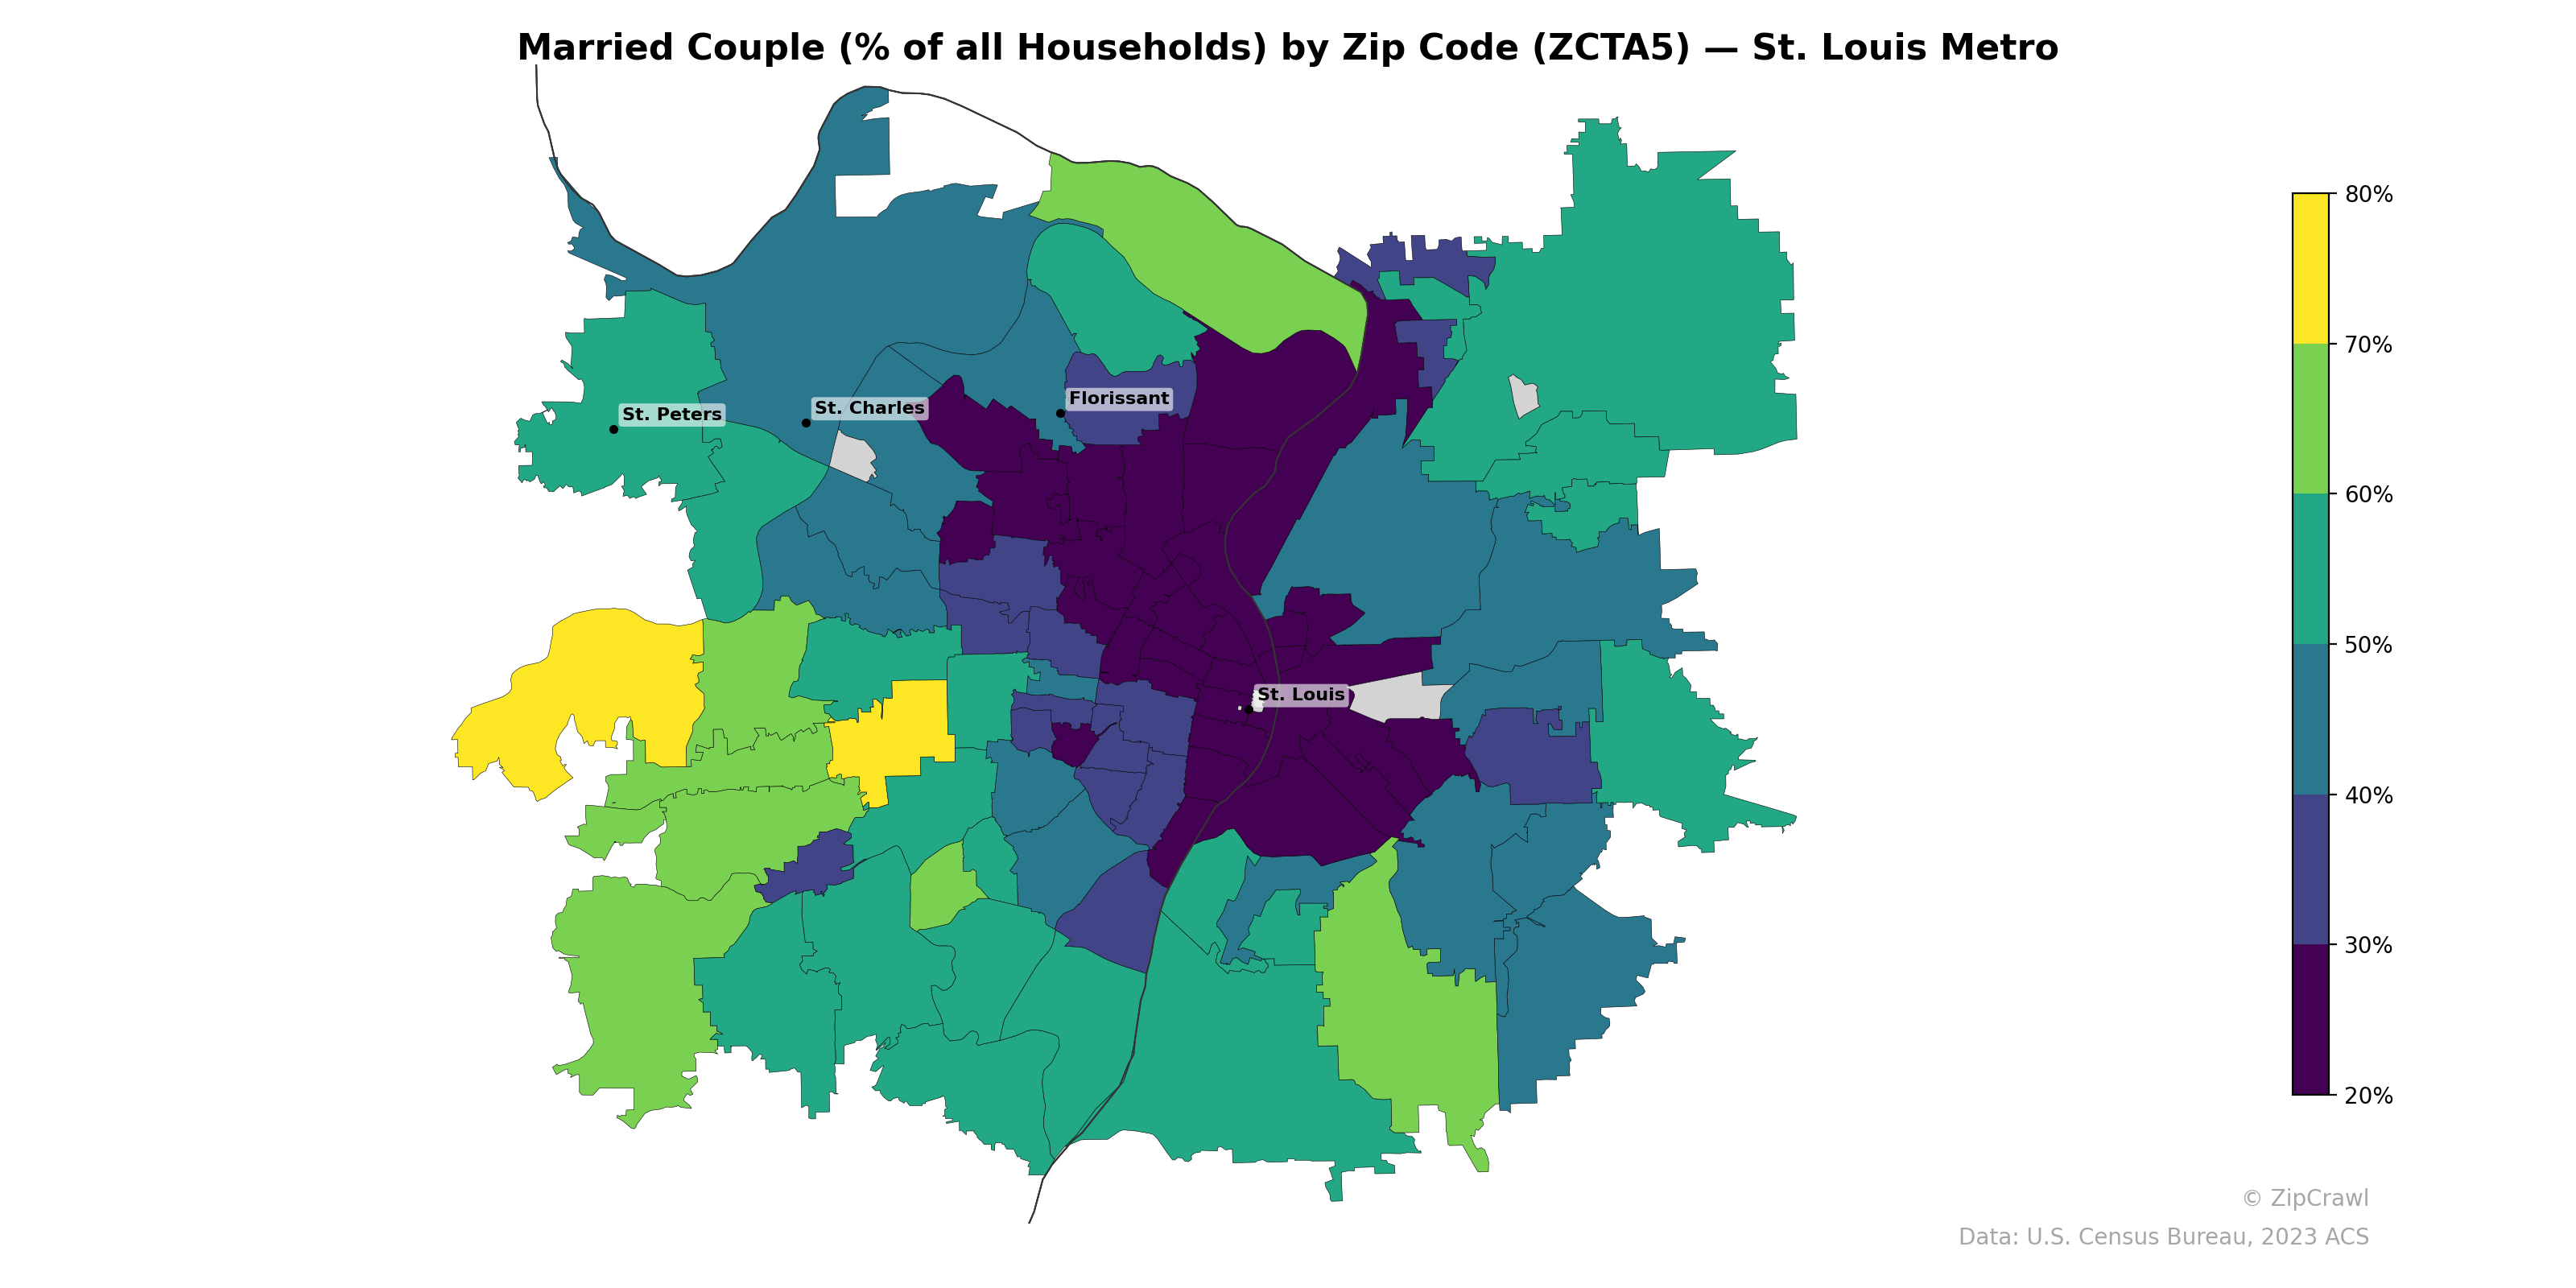
NOTE: Gray indicates insufficient data or a suppressed estimate.
Married-couple households concentrate most heavily in the outer suburban ring, particularly in the western zip codes around St. Peters and southwestern Jefferson County, where rates frequently exceed 70–80%. A stark contrast emerges in the urban core of St. Louis City and the inner north-county suburbs near Florissant, where married-couple shares drop below 20–30%, forming a deep purple cluster that extends northward from downtown. The gradient from core to periphery is notably sharper on the north side of the metro than on the south, where moderate rates in the 50–60% range persist closer to the city boundary.
Data: U.S. Census Bureau, 2023 ACS
Explore
- Household Median Income by Zip Code (ZCTA5) — Texas
- Housing Vacancy Rate by Zip Code (ZCTA5) — St. Louis Metro
- Housing Owner-Occupied % of Units, by Zip Code (ZCTA5) — St. Louis Metro
- % of Households with Broadband Internet, by Zip Code (ZCTA5) — St. Louis Metro
- Household Average Size by Zip Code (ZCTA5) — St. Louis Metro
- Housing Owner-Occupied Median Value ($), by Zip Code (ZCTA5) — St. Louis Metro
- Housing Median Monthly Rent ($), by Zip Code (ZCTA5) — St. Louis Metro
- % of Population without Health Insurance, by Zip Code (ZCTA5) — St. Louis Metro
- Housing % of Units Built Since 2010, by Zip Code (ZCTA5) — St. Louis Metro
- Bachelor's Degree or Higher (% of Over 25) by Zip Code (ZCTA5) — St. Louis Metro
- High School Graduate (% of Over 25) by County
- Population Non-Hispanic White % by Zip Code (ZCTA5) — Texas
- U.S. Citizens (% of Population Over 18) by Zip Code (ZCTA5) — Texas
- Population Non-Hispanic Asian % by Zip Code (ZCTA5) — Chicago Metro
- High School Graduate (% of Over 25) by Zip Code (ZCTA5) — Texas
- % of Population on Food Stamps or SNAP (Last 12 Months), by Zip Code (ZCTA5) — Chicago Metro
- Population Hispanic % by Zip Code (ZCTA5) — Texas
- Median Age by Zip Code (ZCTA5) — Texas
- Population Non-Hispanic Black % by Zip Code (ZCTA5) — Texas
- Housing Vacancy Rate by Zip Code (ZCTA5) — New York Metro
- Population Non-Hispanic American Indian % by Zip Code (ZCTA5) — Texas
- % of Households with Broadband Internet, by Zip Code (ZCTA5) — Baltimore Metro
- Bachelor's Degree or Higher (% of Over 25) by Zip Code (ZCTA5) — Baltimore Metro
- % of Population without Health Insurance, by Zip Code (ZCTA5) — Baltimore Metro
- Population Non-Hispanic Asian % by Zip Code (ZCTA5) — Charlotte Metro
- Population Non-Hispanic Asian % by Zip Code (ZCTA5) — Baltimore Metro
- Household Median Income by Zip Code (ZCTA5) — Baltimore Metro
- High School Graduate (% of Over 25) by Zip Code (ZCTA5) — Baltimore Metro
- % of Population on Food Stamps or SNAP (Last 12 Months), by Zip Code (ZCTA5) — Charlotte Metro
- Population Non-Hispanic Black % by Zip Code (ZCTA5) — Baltimore Metro
- Married Couple (% of all Households) by Zip Code (ZCTA5) — Houston Metro
- Married Couple (% of all Households) by Zip Code (ZCTA5) — Seattle Metro
- Married Couple (% of all Households) by Zip Code (ZCTA5) — Miami Metro
- Married Couple (% of all Households) by Zip Code (ZCTA5) — Louisiana
- Married Couple (% of all Households) by Zip Code (ZCTA5) — Detroit Metro
- Married Couple (% of all Households) by Zip Code (ZCTA5) — Austin Metro
- Married Couple (% of all Households) by Zip Code (ZCTA5) — Dallas Metro
- Married Couple (% of all Households) by Zip Code (ZCTA5) — Boston Metro
- Married Couple (% of all Households) by Zip Code (ZCTA5) — Tampa Metro
- Married Couple (% of all Households) by Zip Code (ZCTA5) — Los Angeles Metro