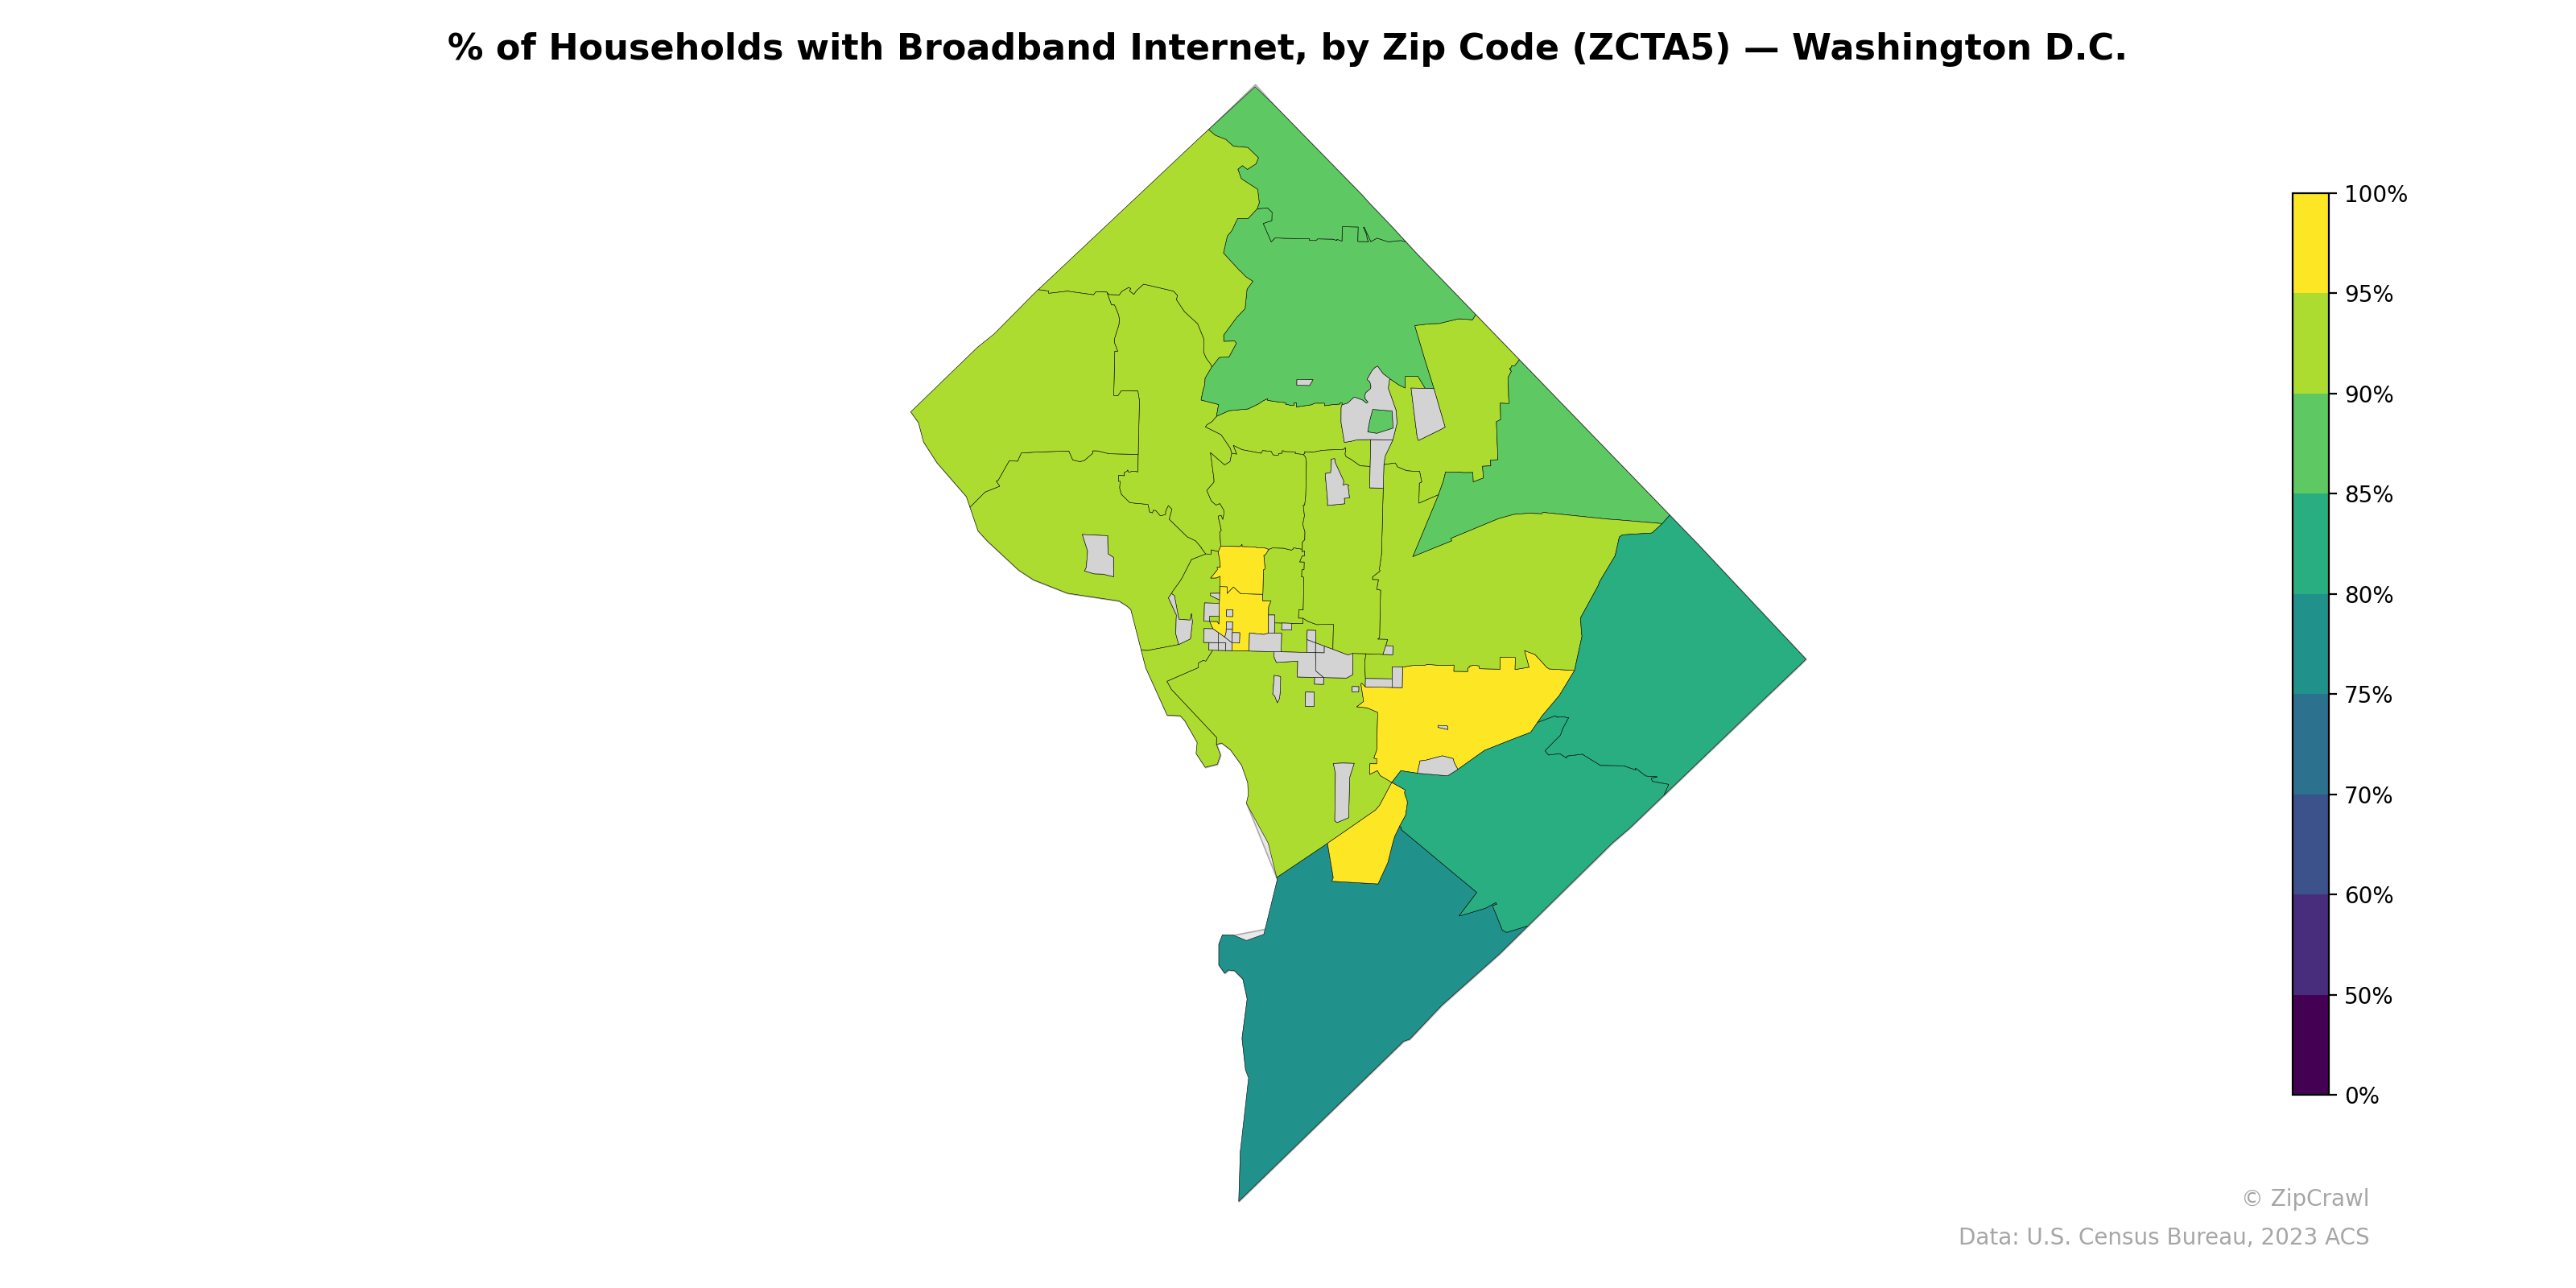
NOTE: Gray indicates insufficient data or a suppressed estimate.
Broadband internet adoption across Washington D.C. exhibits a clear east-west divide, with zip codes in the eastern portion of the district—particularly east of the Anacostia River—showing notably lower connectivity rates in the 70–80% range, while northwestern neighborhoods consistently reach 90% or above. A cluster of high-adoption zip codes (approaching 95–100%) is visible in the central-west corridor, likely encompassing areas such as Dupont Circle, Georgetown, and upper Northwest. The southern tip of the district also shows relatively high broadband penetration, contrasting with the adjacent lower-connectivity zones in the southeastern quadrant.
Data: U.S. Census Bureau, 2023 ACS
Explore
- Median Age by Zip Code (ZCTA5) — Illinois
- Household Average Size by Zip Code (ZCTA5) — Washington D.C.
- Housing Median Monthly Rent ($), by Zip Code (ZCTA5) — Washington D.C.
- Housing Owner-Occupied Median Value ($), by Zip Code (ZCTA5) — Washington D.C.
- Population Non-Hispanic American Indian % by Zip Code (ZCTA5) — Washington D.C.
- Housing % of Units Built Since 2010, by Zip Code (ZCTA5) — Washington D.C.
- Housing Owner-Occupied % of Units, by Zip Code (ZCTA5) — Washington D.C.
- Bachelor's Degree or Higher (% of Over 25) by Zip Code (ZCTA5) — Washington D.C.
- % of Population without Health Insurance, by Zip Code (ZCTA5) — Washington D.C.
- High School Graduate (% of Over 25) by Zip Code (ZCTA5) — Washington D.C.
- Married Couple (% of all Households) by County
- Population Non-Hispanic Black % by Zip Code (ZCTA5) — Illinois
- High School Graduate (% of Over 25) by Zip Code (ZCTA5) — Illinois
- Population Non-Hispanic American Indian % by Zip Code (ZCTA5) — Illinois
- Household Median Income by Zip Code (ZCTA5) — Detroit Metro
- Household Median Income by Zip Code (ZCTA5) — New York
- Household Median Income by Zip Code (ZCTA5) — Illinois
- Population Non-Hispanic White % by Zip Code (ZCTA5) — Illinois
- Population Non-Hispanic Asian % by Zip Code (ZCTA5) — New York
- U.S. Citizens (% of Population Over 18) by Zip Code (ZCTA5) — Illinois
- % of Population on Food Stamps or SNAP (Last 12 Months), by Zip Code (ZCTA5) — New York
- Population Hispanic % by Zip Code (ZCTA5) — Illinois
- Population Non-Hispanic American Indian % by Zip Code (ZCTA5) — Vermont
- Bachelor's Degree or Higher (% of Over 25) by Zip Code (ZCTA5) — Vermont
- Population Non-Hispanic Asian % by Zip Code (ZCTA5) — Vermont
- Population Hispanic % by Zip Code (ZCTA5) — Washington D.C.
- High School Graduate (% of Over 25) by Zip Code (ZCTA5) — Vermont
- % of Population without Health Insurance, by Zip Code (ZCTA5) — Oregon
- % of Population without Health Insurance, by Zip Code (ZCTA5) — Vermont
- Housing Vacancy Rate by Zip Code (ZCTA5) — Vermont
- % of Households with Broadband Internet, by Zip Code (ZCTA5) — Washington
- % of Households with Broadband Internet, by Zip Code (ZCTA5) — Washington D.C. Metro
- % of Households with Broadband Internet, by Zip Code (ZCTA5) — Oregon
- % of Households with Broadband Internet, by Zip Code (ZCTA5) — Iowa
- % of Households with Broadband Internet, by Zip Code (ZCTA5) — Ohio
- % of Households with Broadband Internet, by Zip Code (ZCTA5) — Wyoming
- % of Households with Broadband Internet, by Zip Code (ZCTA5) — Utah
- % of Households with Broadband Internet, by Zip Code (ZCTA5) — Idaho
- % of Households with Broadband Internet, by Zip Code (ZCTA5) — Houston Metro
- % of Households with Broadband Internet, by Zip Code (ZCTA5) — Texas