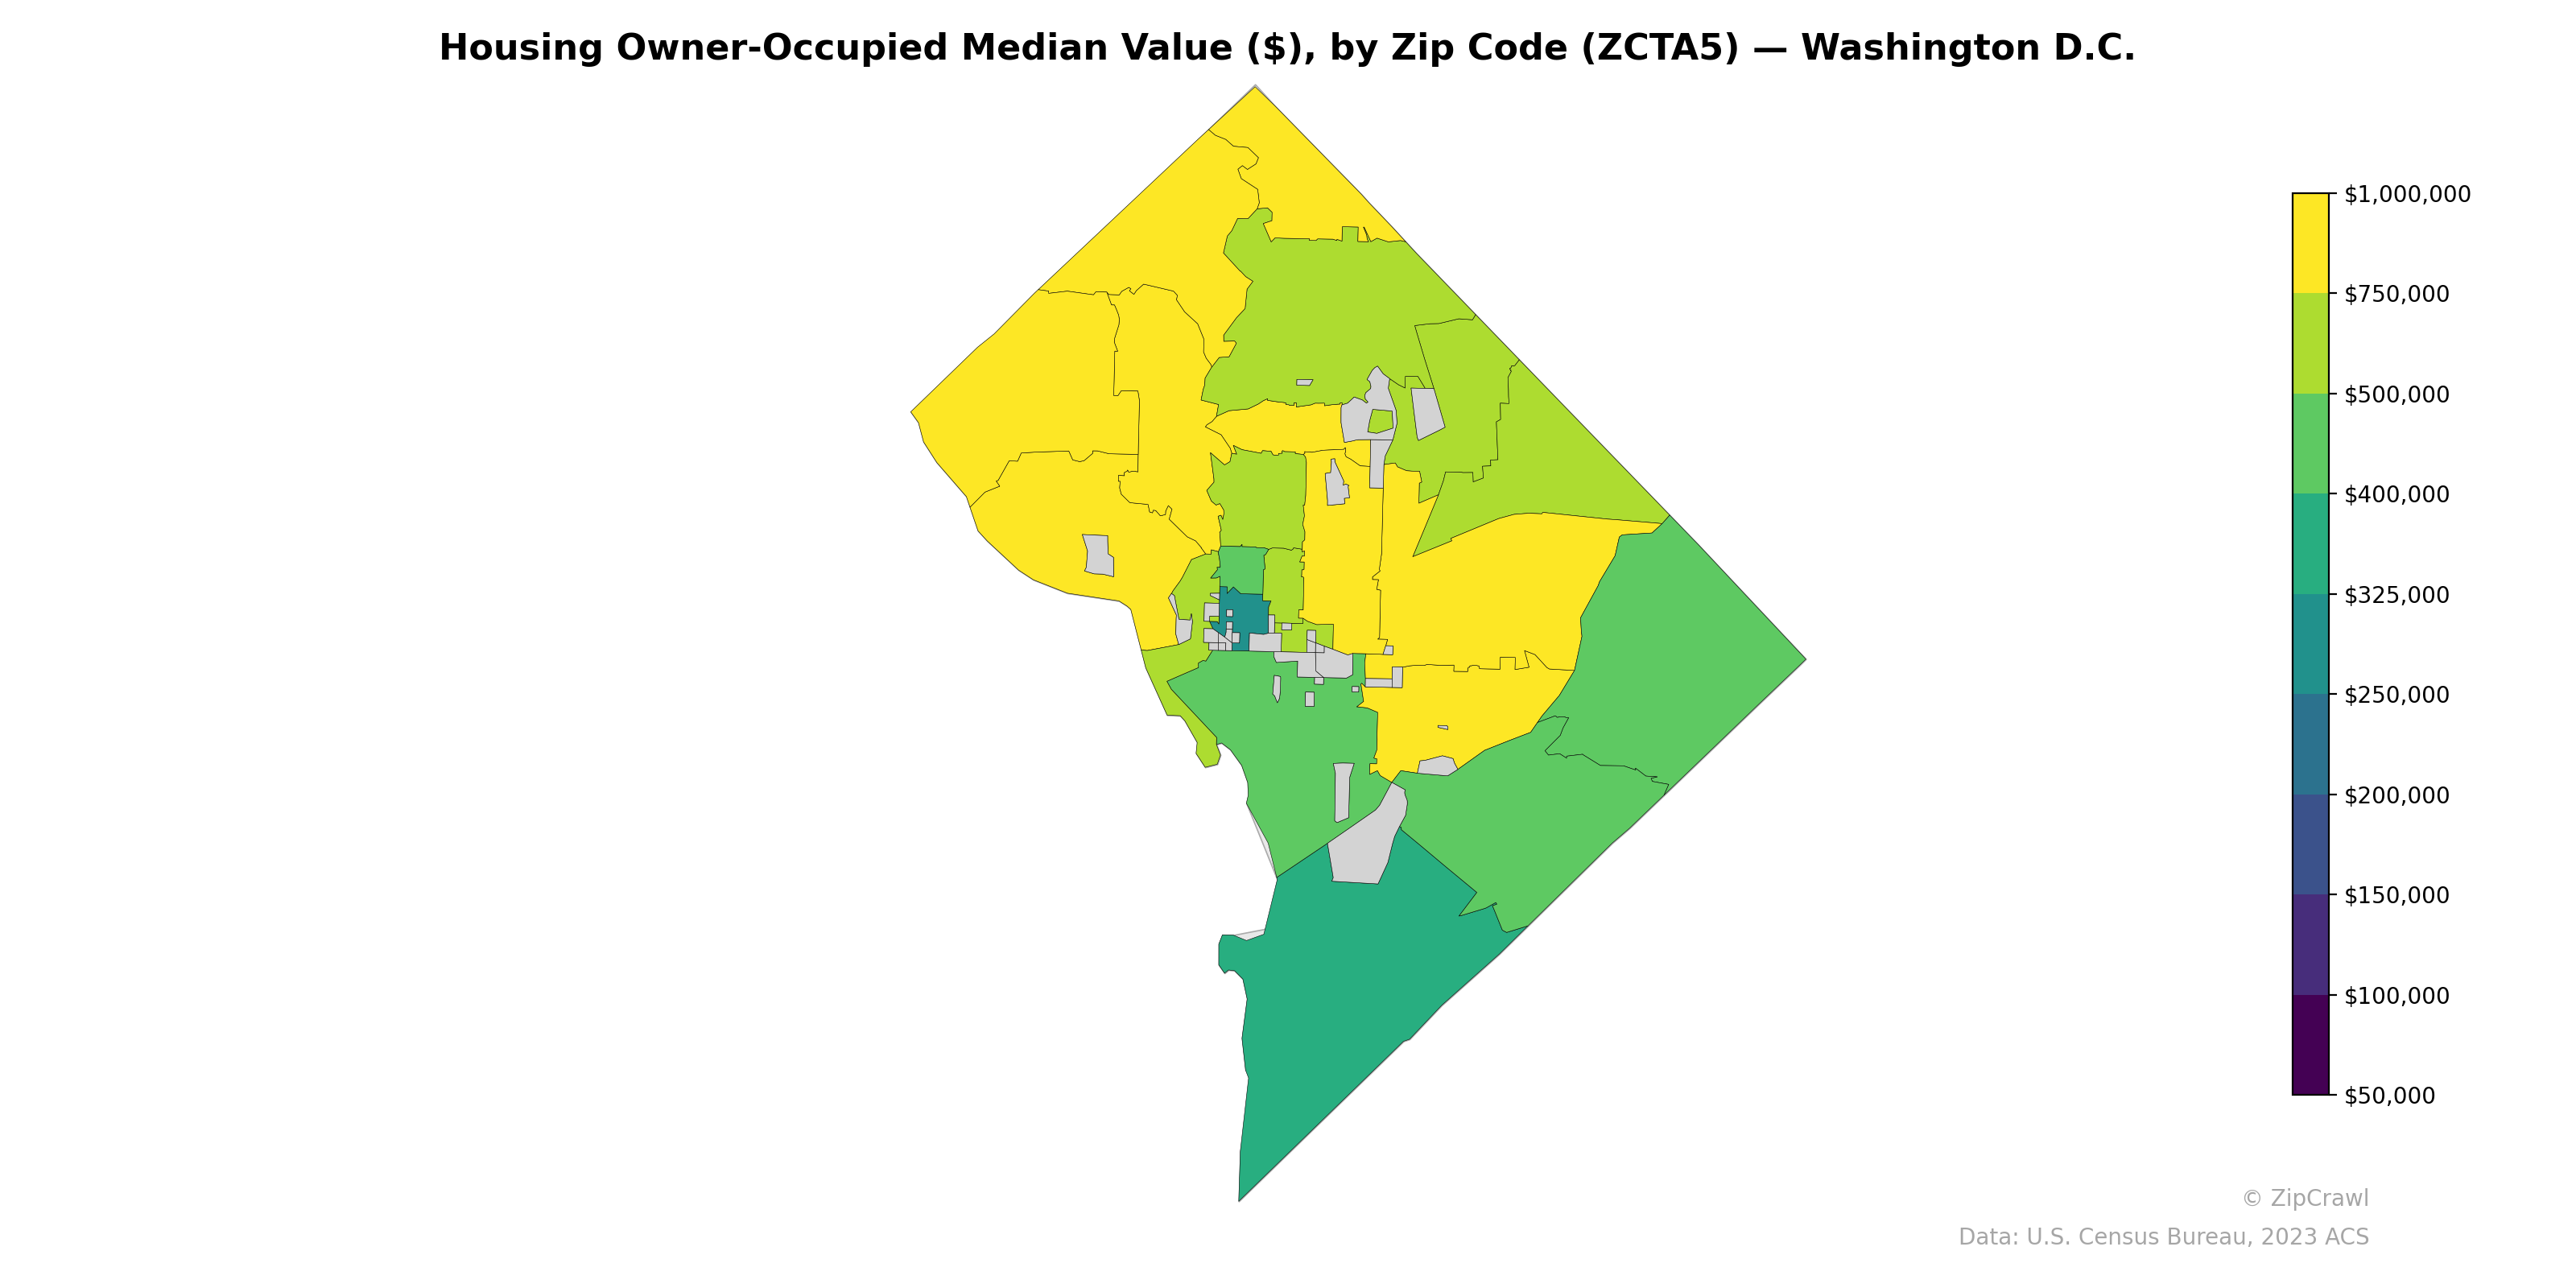
NOTE: Gray indicates insufficient data or a suppressed estimate.
Median owner-occupied housing values in Washington D.C. exhibit a stark northwest-to-southeast gradient, with zip codes in the upper Northwest quadrant—including areas like Chevy Chase, Tenleytown, and Cleveland Park—reaching $750,000 to over $1,000,000, while southeastern zip codes east of the Anacostia River generally fall below $325,000. A cluster of high-value zones also extends through the central-west corridor encompassing Georgetown and Dupont Circle, contrasting sharply with adjacent lower-value pockets in the immediate downtown core. The southeastern quadrant represents the most uniformly affordable area of the District, with several contiguous zip codes in the $200,000–$325,000 range, underscoring persistent geographic wealth disparities across the city.
Data: U.S. Census Bureau, 2023 ACS
Explore
- Median Age by Zip Code (ZCTA5) — Illinois
- Housing Median Monthly Rent ($), by Zip Code (ZCTA5) — Washington D.C.
- Housing Owner-Occupied % of Units, by Zip Code (ZCTA5) — Washington D.C.
- Bachelor's Degree or Higher (% of Over 25) by Zip Code (ZCTA5) — Washington D.C.
- Housing % of Units Built Since 2010, by Zip Code (ZCTA5) — Washington D.C.
- Household Average Size by Zip Code (ZCTA5) — Washington D.C.
- % of Population without Health Insurance, by Zip Code (ZCTA5) — Washington D.C.
- % of Households with Broadband Internet, by Zip Code (ZCTA5) — Washington D.C.
- Population Non-Hispanic American Indian % by Zip Code (ZCTA5) — Washington D.C.
- High School Graduate (% of Over 25) by Zip Code (ZCTA5) — Washington D.C.
- Married Couple (% of all Households) by County
- High School Graduate (% of Over 25) by Zip Code (ZCTA5) — Illinois
- Population Hispanic % by Zip Code (ZCTA5) — Detroit Metro
- Population Non-Hispanic American Indian % by Zip Code (ZCTA5) — Illinois
- Population Non-Hispanic White % by Zip Code (ZCTA5) — Illinois
- Household Median Income by Zip Code (ZCTA5) — Illinois
- Population Hispanic % by Zip Code (ZCTA5) — Illinois
- Population Hispanic % by Zip Code (ZCTA5) — New York
- Population Non-Hispanic Asian % by Zip Code (ZCTA5) — New York
- U.S. Citizens (% of Population Over 18) by Zip Code (ZCTA5) — Illinois
- % of Population on Food Stamps or SNAP (Last 12 Months), by Zip Code (ZCTA5) — New York
- Population Non-Hispanic Black % by Zip Code (ZCTA5) — Illinois
- Population Non-Hispanic American Indian % by Zip Code (ZCTA5) — Vermont
- Bachelor's Degree or Higher (% of Over 25) by Zip Code (ZCTA5) — Vermont
- Population Non-Hispanic Asian % by Zip Code (ZCTA5) — Vermont
- Population Hispanic % by Zip Code (ZCTA5) — Washington D.C.
- High School Graduate (% of Over 25) by Zip Code (ZCTA5) — Vermont
- % of Population without Health Insurance, by Zip Code (ZCTA5) — Oregon
- Married Couple (% of all Households) by Zip Code (ZCTA5) — Vermont
- % of Households with Broadband Internet, by Zip Code (ZCTA5) — Vermont
- Housing Owner-Occupied Median Value ($), by Zip Code (ZCTA5) — Washington
- Housing Owner-Occupied Median Value ($), by Zip Code (ZCTA5) — Washington D.C. Metro
- Housing Owner-Occupied Median Value ($), by Zip Code (ZCTA5) — Houston Metro
- Housing Owner-Occupied Median Value ($), by Zip Code (ZCTA5) — Wyoming
- Housing Owner-Occupied Median Value ($), by Zip Code (ZCTA5) — Oregon
- Housing Owner-Occupied Median Value ($), by Zip Code (ZCTA5) — Ohio
- Housing Owner-Occupied Median Value ($), by Zip Code (ZCTA5) — Maine
- Housing Owner-Occupied Median Value ($), by Zip Code (ZCTA5) — Utah
- Housing Owner-Occupied Median Value ($), by Zip Code (ZCTA5) — Iowa
- Housing Owner-Occupied Median Value ($), by Zip Code (ZCTA5) — Boston Metro