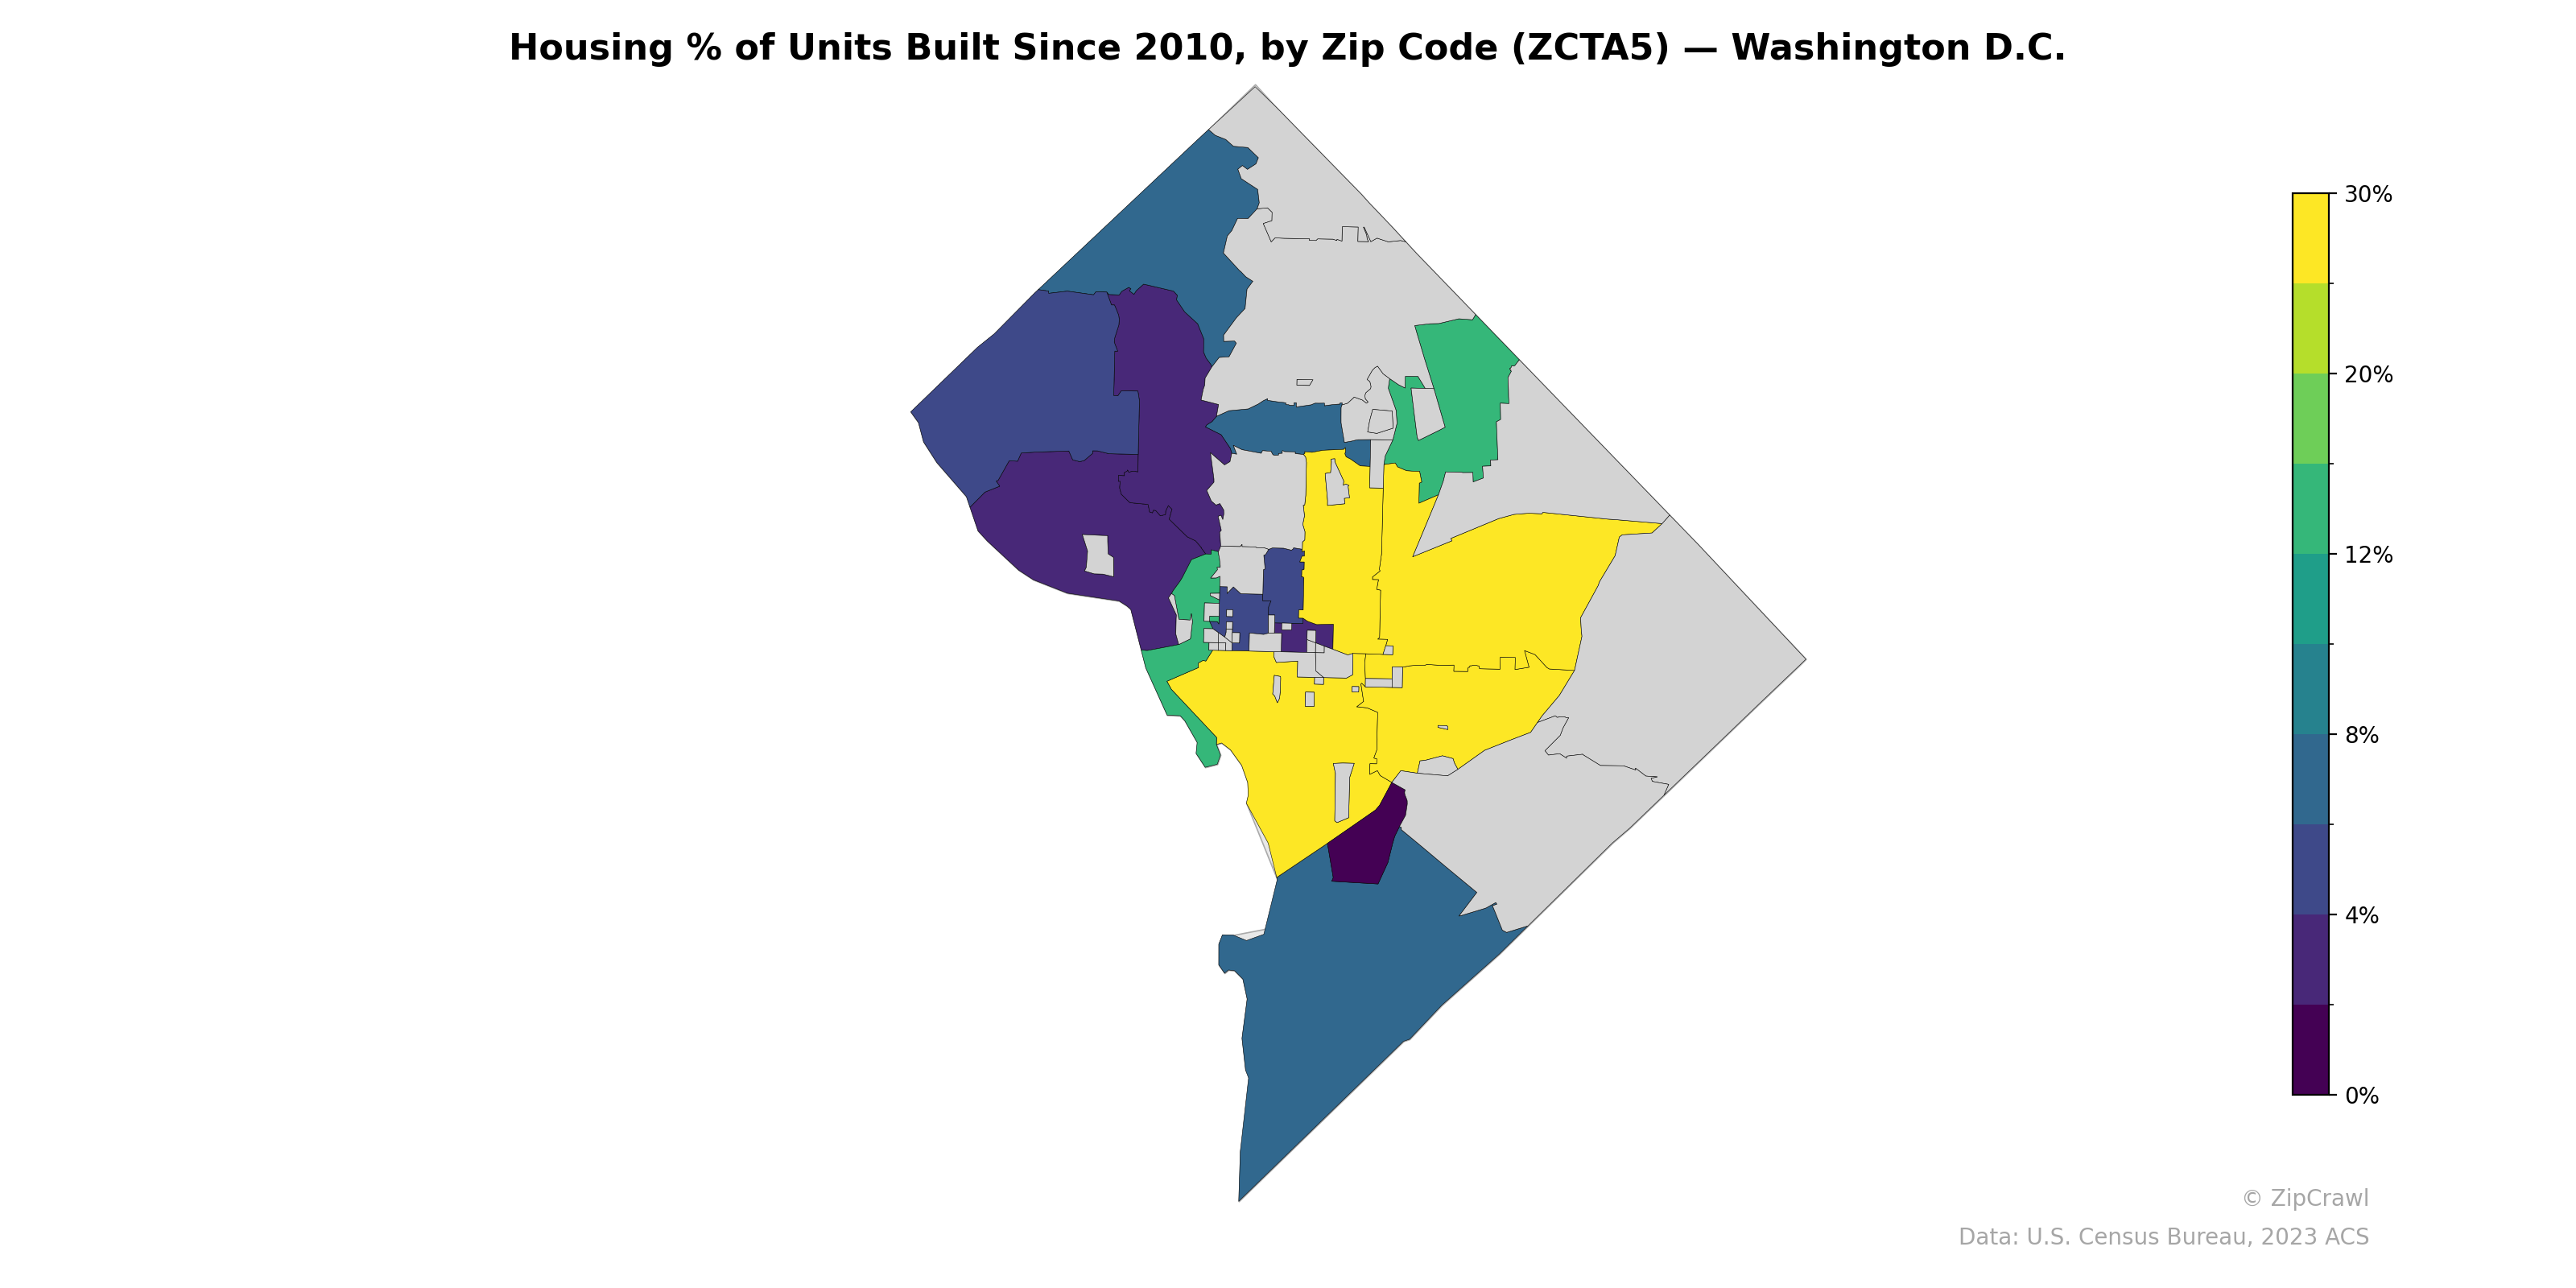
NOTE: Gray indicates insufficient data or a suppressed estimate.
The highest concentrations of post-2010 housing construction, exceeding 20–30%, are clustered in the central and southeastern portions of the District, particularly in zip codes spanning the Navy Yard, Capitol Riverfront, and NoMa corridors—areas that have experienced significant redevelopment over the past decade. In stark contrast, the northwestern quadrant, encompassing established neighborhoods like Georgetown, Tenleytown, and upper Northwest, registers near 0% new construction, reflecting the built-out nature and historic preservation constraints of those areas. A few zip codes in the northeastern periphery and around the Wharf/Southwest Waterfront also show elevated rates of new unit production, while large swaths of gray (no data) along the eastern boundary likely correspond to federally owned land or low-density areas with limited residential development.
Data: U.S. Census Bureau, 2023 ACS
Explore
- Median Age by Zip Code (ZCTA5) — Illinois
- Housing Median Monthly Rent ($), by Zip Code (ZCTA5) — Washington D.C.
- High School Graduate (% of Over 25) by Zip Code (ZCTA5) — Washington D.C.
- Population Non-Hispanic American Indian % by Zip Code (ZCTA5) — Washington D.C.
- Housing Owner-Occupied % of Units, by Zip Code (ZCTA5) — Washington D.C.
- Housing Owner-Occupied Median Value ($), by Zip Code (ZCTA5) — Washington D.C.
- Household Average Size by Zip Code (ZCTA5) — Washington D.C.
- % of Households with Broadband Internet, by Zip Code (ZCTA5) — Washington D.C.
- Bachelor's Degree or Higher (% of Over 25) by Zip Code (ZCTA5) — Washington D.C.
- % of Population without Health Insurance, by Zip Code (ZCTA5) — Washington D.C.
- Married Couple (% of all Households) by County
- Population Non-Hispanic American Indian % by Zip Code (ZCTA5) — Illinois
- High School Graduate (% of Over 25) by Zip Code (ZCTA5) — Illinois
- Population Non-Hispanic American Indian % by Zip Code (ZCTA5) — Detroit Metro
- Population Non-Hispanic White % by Zip Code (ZCTA5) — Illinois
- Household Median Income by Zip Code (ZCTA5) — Illinois
- Population Hispanic % by Zip Code (ZCTA5) — Illinois
- Population Non-Hispanic Asian % by Zip Code (ZCTA5) — New York
- % of Population on Food Stamps or SNAP (Last 12 Months), by Zip Code (ZCTA5) — New York
- Population Non-Hispanic Black % by Zip Code (ZCTA5) — Illinois
- U.S. Citizens (% of Population Over 18) by Zip Code (ZCTA5) — Illinois
- Population Non-Hispanic American Indian % by Zip Code (ZCTA5) — New York
- Housing Vacancy Rate by Zip Code (ZCTA5) — Vermont
- Bachelor's Degree or Higher (% of Over 25) by Zip Code (ZCTA5) — Vermont
- Population Non-Hispanic Asian % by Zip Code (ZCTA5) — Vermont
- % of Households with Broadband Internet, by Zip Code (ZCTA5) — Vermont
- High School Graduate (% of Over 25) by Zip Code (ZCTA5) — Vermont
- % of Population without Health Insurance, by Zip Code (ZCTA5) — Oregon
- Population Non-Hispanic American Indian % by Zip Code (ZCTA5) — Vermont
- Population Hispanic % by Zip Code (ZCTA5) — Washington D.C.
- Housing % of Units Built Since 2010, by Zip Code (ZCTA5) — Washington
- Housing % of Units Built Since 2010, by Zip Code (ZCTA5) — Washington D.C. Metro
- Housing % of Units Built Since 2010, by Zip Code (ZCTA5) — Wyoming
- Housing % of Units Built Since 2010, by Zip Code (ZCTA5) — Oregon
- Housing % of Units Built Since 2010, by Zip Code (ZCTA5) — Ohio
- Housing % of Units Built Since 2010, by Zip Code (ZCTA5) — Utah
- Housing % of Units Built Since 2010, by Zip Code (ZCTA5) — Iowa
- Housing % of Units Built Since 2010, by Zip Code (ZCTA5) — Houston Metro
- Housing % of Units Built Since 2010, by Zip Code (ZCTA5) — Texas
- Housing % of Units Built Since 2010, by Zip Code (ZCTA5) — Idaho