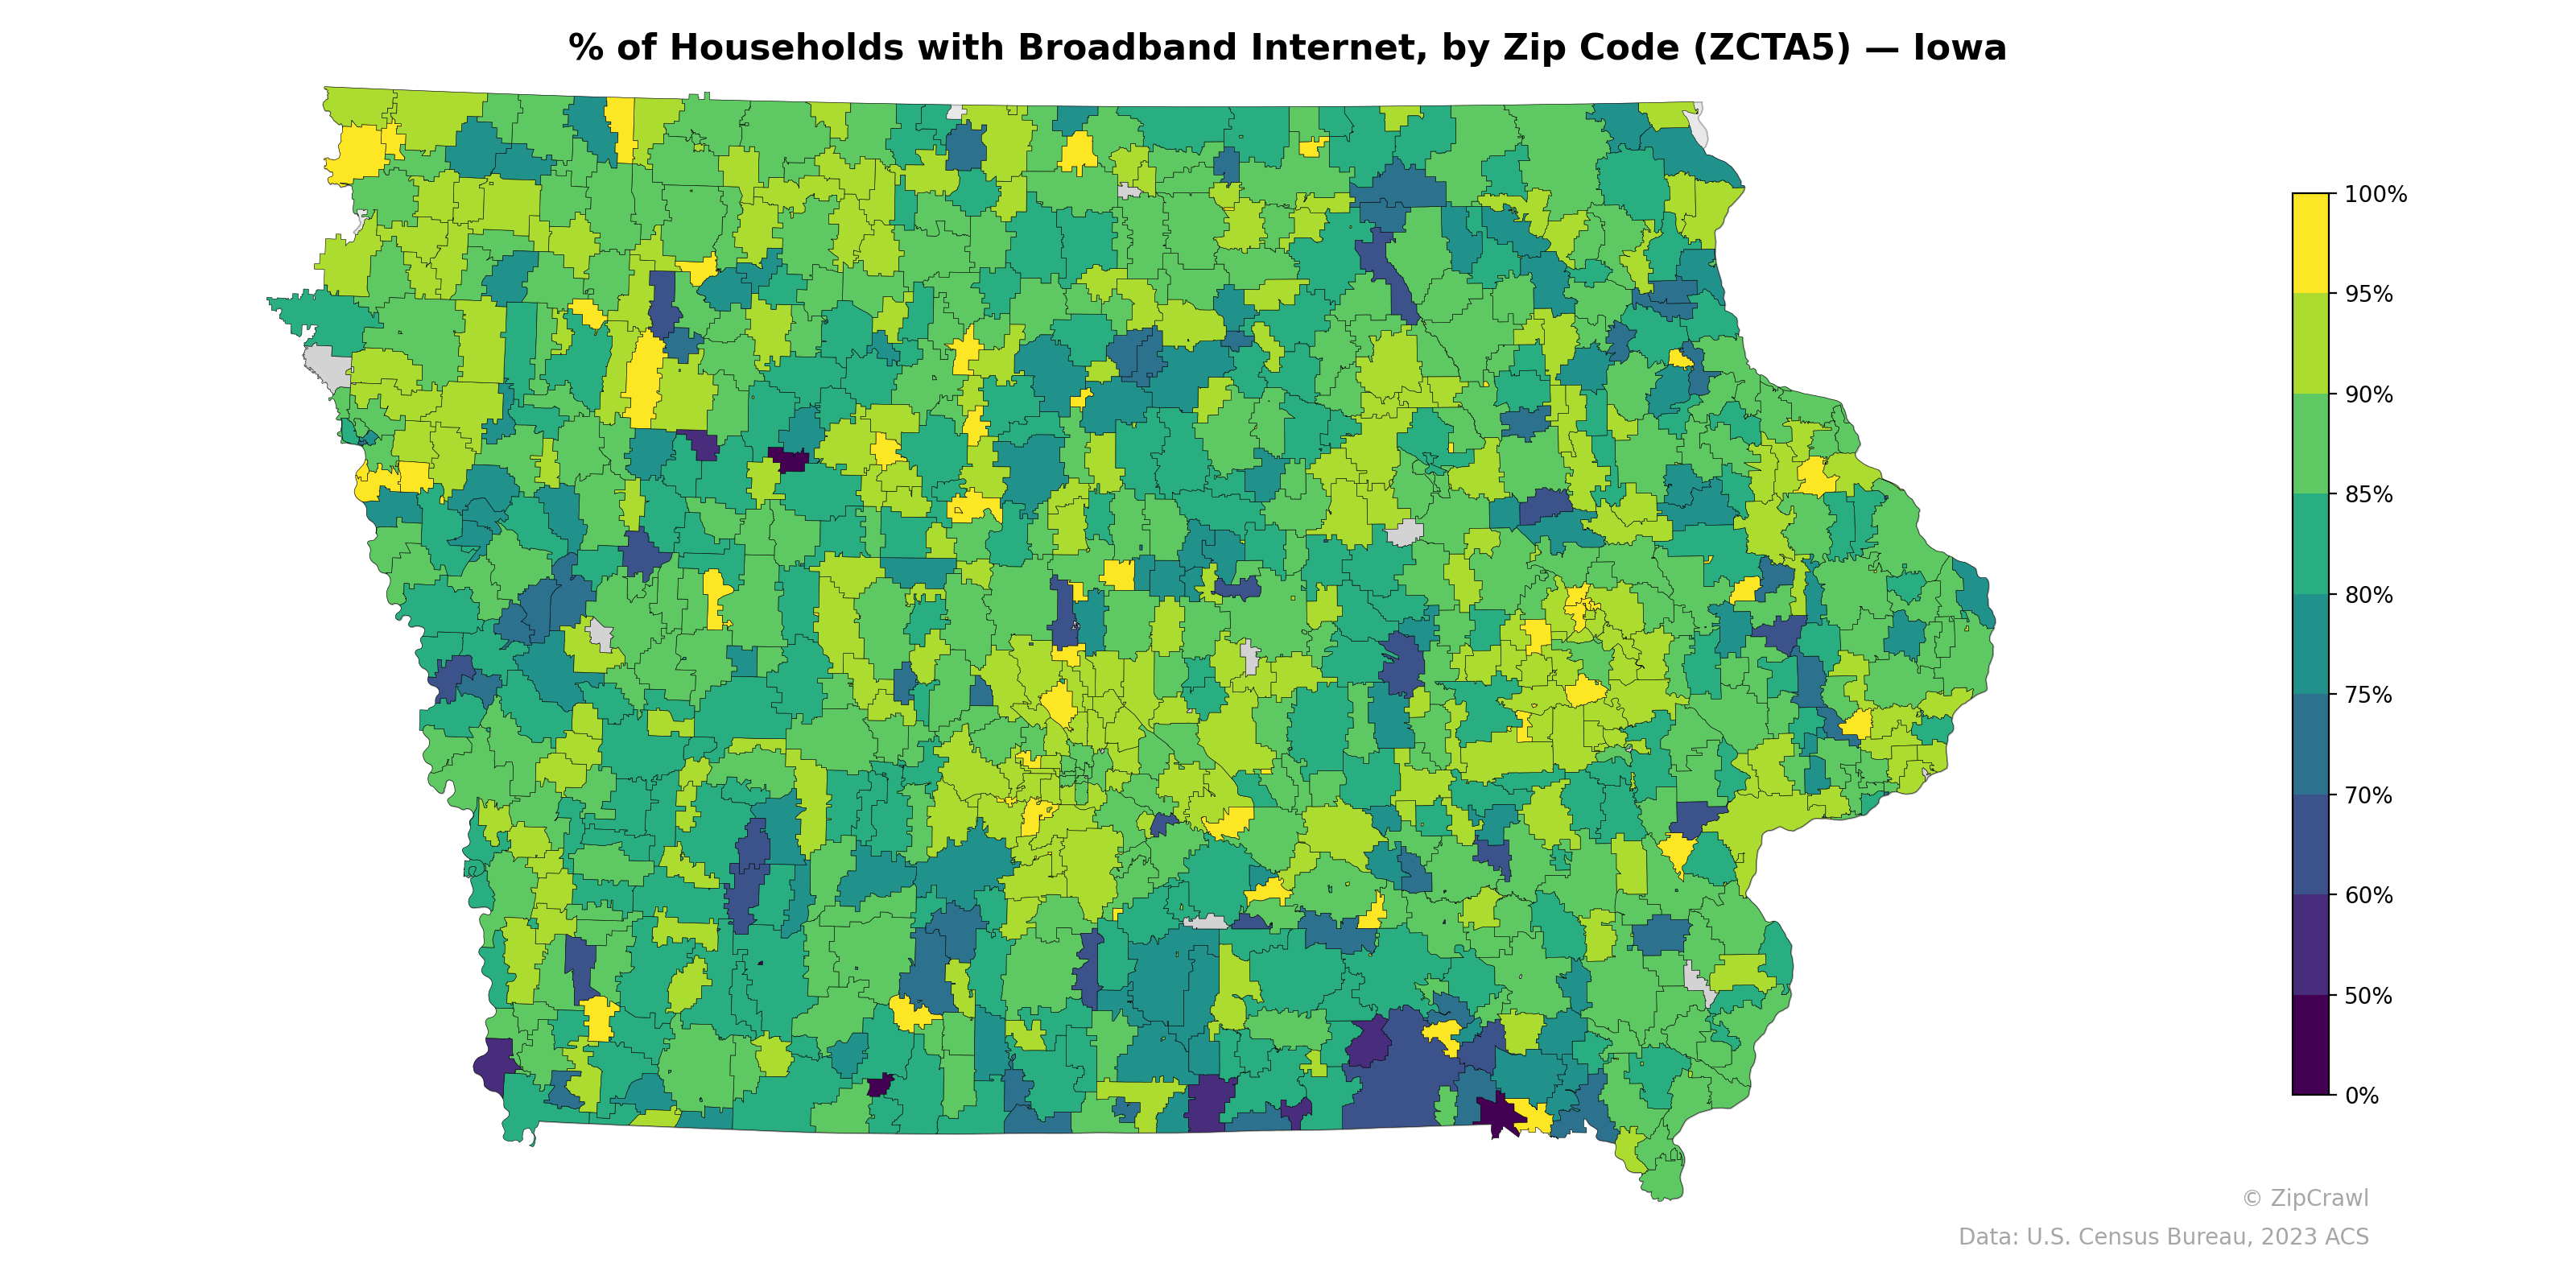
NOTE: Gray indicates insufficient data or a suppressed estimate.
Broadband adoption across Iowa's zip codes generally falls in the 75–90% range, with notable pockets of higher connectivity (above 90%) concentrated in suburban areas surrounding Des Moines, Cedar Rapids, and the Iowa City corridor. Rural zip codes in southern Iowa and parts of western Iowa display consistently lower broadband penetration, often dipping below 70%, while scattered zip codes in the extreme southeast corner near the Missouri border register some of the state's lowest rates at or below 50%. A few small, isolated zip codes throughout the central and northern portions of the state also appear as dark outliers, likely reflecting very small population bases where a handful of unconnected households significantly skew the percentage.
Data: U.S. Census Bureau, 2023 ACS
Explore
- Median Age by Zip Code (ZCTA5) — Florida
- Population Non-Hispanic American Indian % by Zip Code (ZCTA5) — Iowa
- Housing Owner-Occupied Median Value ($), by Zip Code (ZCTA5) — Iowa
- Housing Owner-Occupied % of Units, by Zip Code (ZCTA5) — Iowa
- Housing % of Units Built Since 2010, by Zip Code (ZCTA5) — Iowa
- Household Average Size by Zip Code (ZCTA5) — Iowa
- % of Population without Health Insurance, by Zip Code (ZCTA5) — Iowa
- Bachelor's Degree or Higher (% of Over 25) by Zip Code (ZCTA5) — Iowa
- Housing Median Monthly Rent ($), by Zip Code (ZCTA5) — Iowa
- High School Graduate (% of Over 25) by Zip Code (ZCTA5) — Iowa
- Housing Owner-Occupied Median Value ($), by County
- Household Median Income by Zip Code (ZCTA5) — New York
- Household Median Income by Zip Code (ZCTA5) — Dallas Metro
- Population Non-Hispanic American Indian % by Zip Code (ZCTA5) — Florida
- High School Graduate (% of Over 25) by Zip Code (ZCTA5) — Florida
- Population Non-Hispanic White % by Zip Code (ZCTA5) — Florida
- Household Median Income by Zip Code (ZCTA5) — Florida
- Population Hispanic % by Zip Code (ZCTA5) — Florida
- Population Non-Hispanic Asian % by Zip Code (ZCTA5) — California
- U.S. Citizens (% of Population Over 18) by Zip Code (ZCTA5) — Florida
- % of Population on Food Stamps or SNAP (Last 12 Months), by Zip Code (ZCTA5) — California
- Population Non-Hispanic Black % by Zip Code (ZCTA5) — Florida
- Household Average Size by Zip Code (ZCTA5) — Connecticut
- Population Non-Hispanic American Indian % by Zip Code (ZCTA5) — Connecticut
- Married Couple (% of all Households) by Zip Code (ZCTA5) — Connecticut
- High School Graduate (% of Over 25) by Zip Code (ZCTA5) — Connecticut
- Population Hispanic % by Zip Code (ZCTA5) — Mississippi
- Household Median Income by Zip Code (ZCTA5) — Iowa
- Median Age by Zip Code (ZCTA5) — Iowa
- Housing Median Monthly Rent ($), by Zip Code (ZCTA5) — Nevada
- % of Households with Broadband Internet, by Zip Code (ZCTA5) — Ohio
- % of Households with Broadband Internet, by Zip Code (ZCTA5) — Idaho
- % of Households with Broadband Internet, by Zip Code (ZCTA5) — Utah
- % of Households with Broadband Internet, by Zip Code (ZCTA5) — Texas
- % of Households with Broadband Internet, by Zip Code (ZCTA5) — Oregon
- % of Households with Broadband Internet, by Zip Code (ZCTA5) — Maine
- % of Households with Broadband Internet, by Zip Code (ZCTA5) — Indiana
- % of Households with Broadband Internet, by Zip Code (ZCTA5) — Hawaii
- % of Households with Broadband Internet, by Zip Code (ZCTA5) — Nevada
- % of Households with Broadband Internet, by Zip Code (ZCTA5) — Kansas