NOTE: Gray indicates insufficient data or a suppressed estimate.
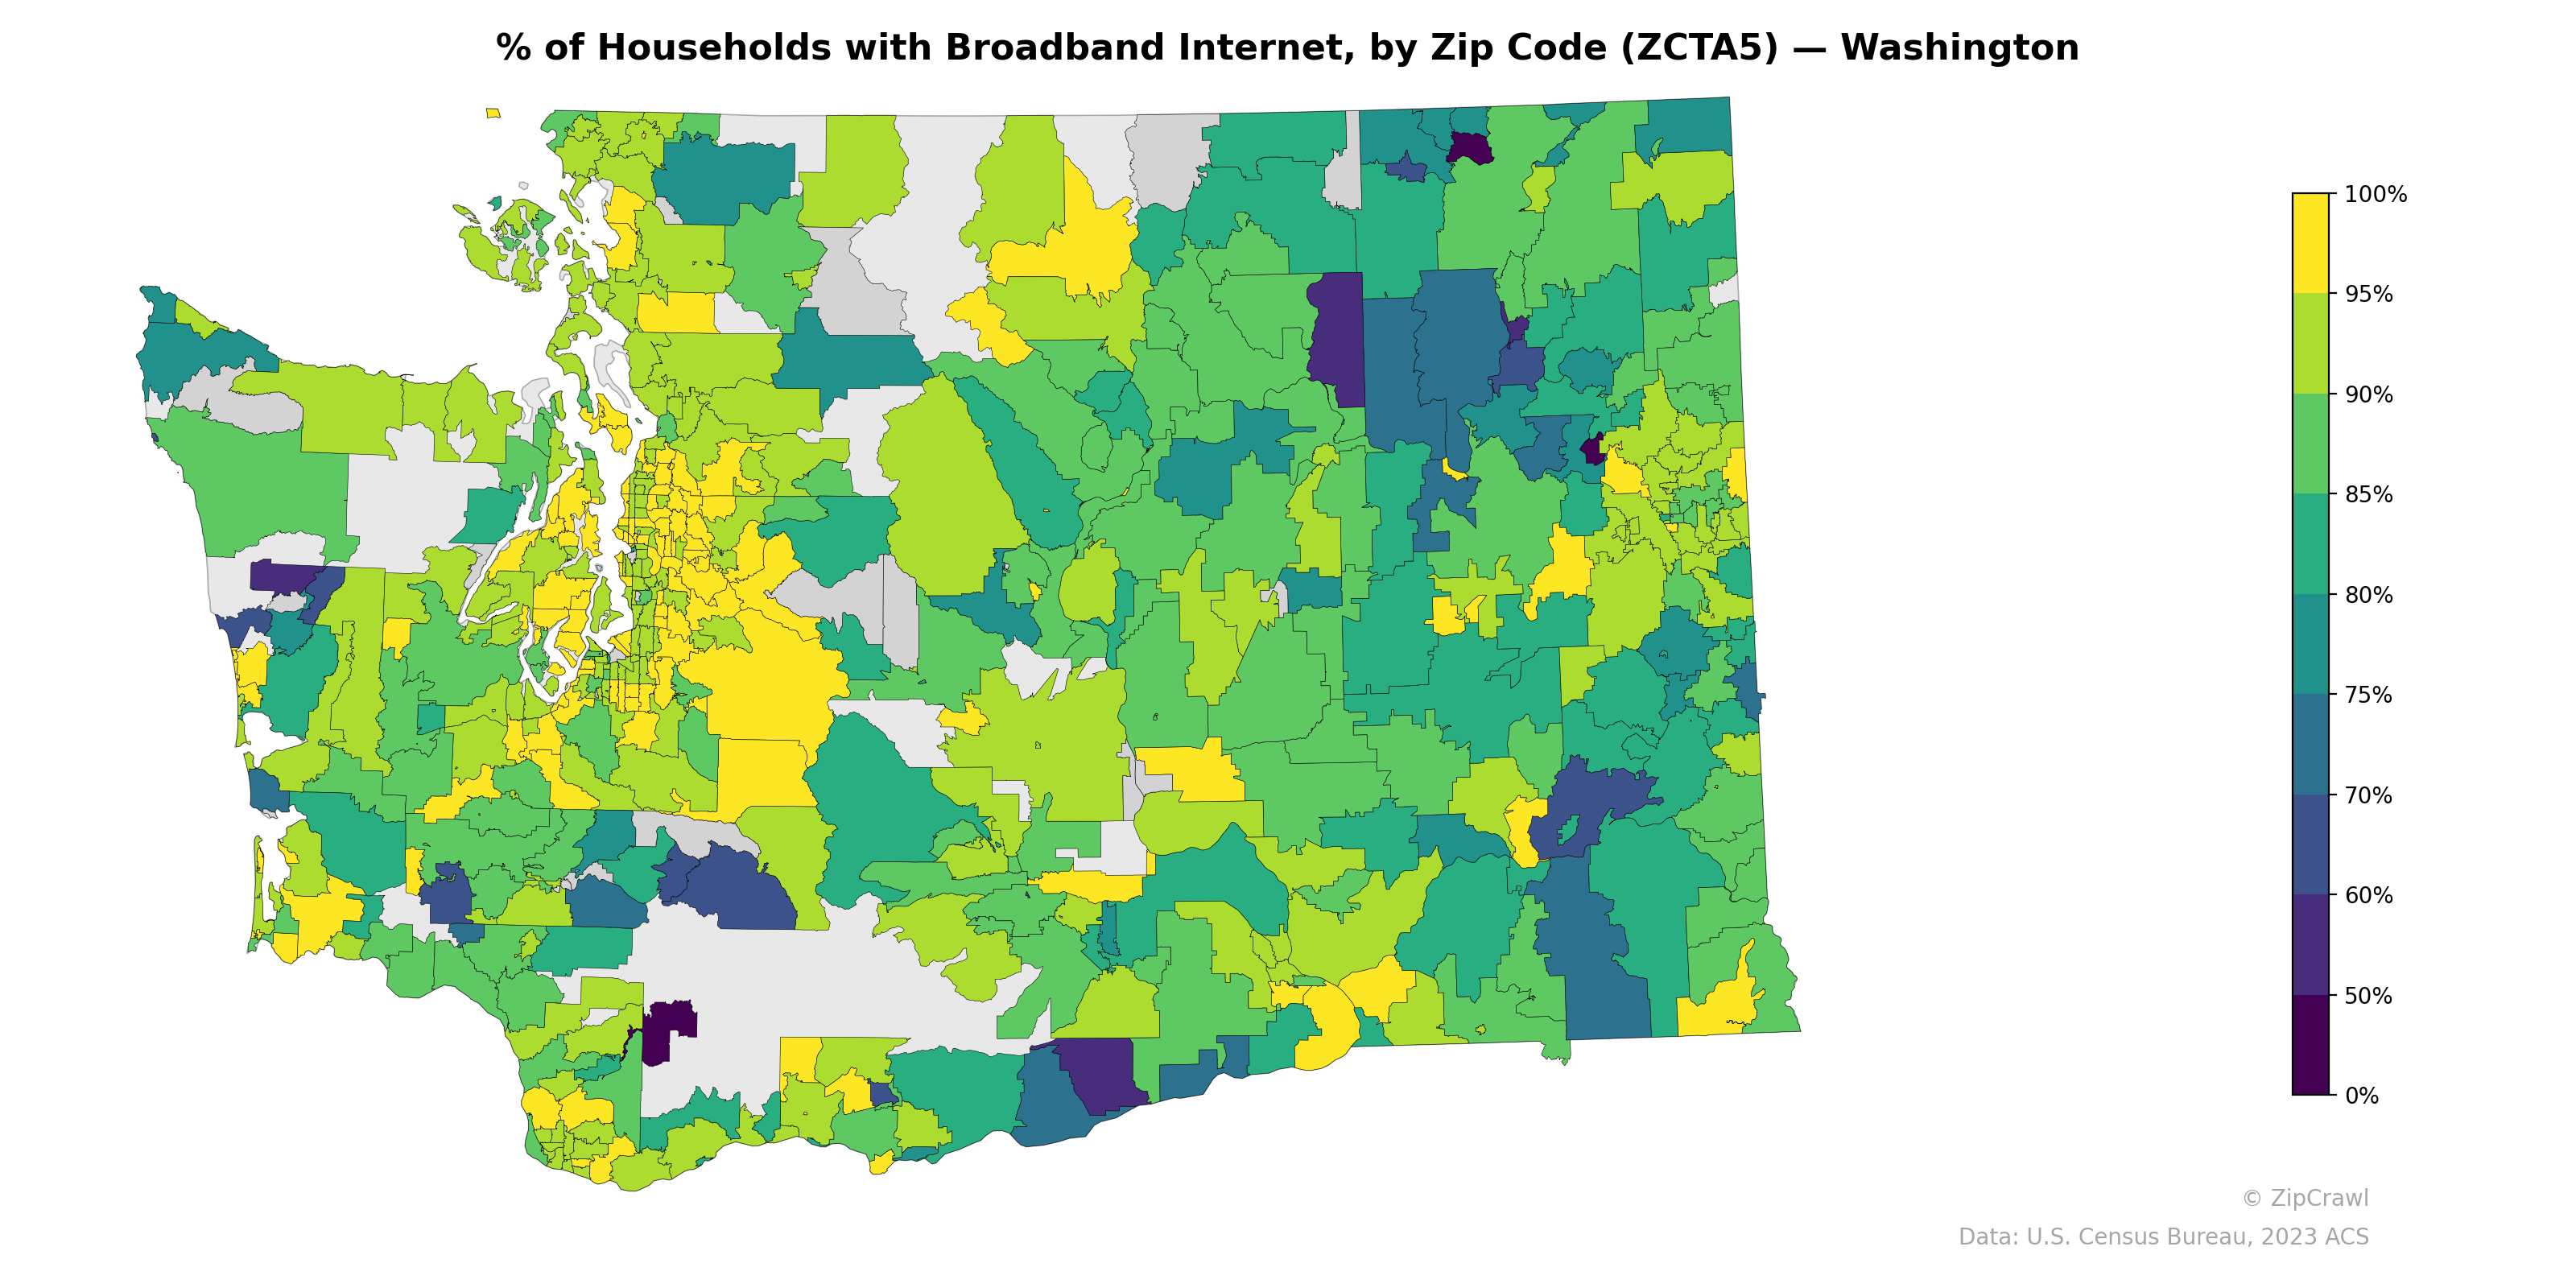
The Seattle-Tacoma-Bellevue metropolitan corridor and surrounding Puget Sound suburbs consistently exhibit the highest broadband adoption rates, with many zip codes reaching 90–100%, while rural eastern Washington and parts of the Olympic Peninsula show notably lower penetration, frequently falling below 70%. A stark urban-rural divide is evident, with isolated pockets of very low connectivity (under 50%) appearing in central Washington's agricultural regions and along the southeastern border near the Blue Mountains. Several small dark-shaded zip codes scattered across the northeast and south-central portions of the state likely correspond to tribal lands or extremely remote communities facing persistent infrastructure gaps.
Data: U.S. Census Bureau, 2023 ACS
Explore
- Population Non-Hispanic Black % by Zip Code (ZCTA5) — Los Angeles Metro
- Married Couple (% of all Households) by Zip Code (ZCTA5) — Washington
- Bachelor's Degree or Higher (% of Over 25) by Zip Code (ZCTA5) — Washington
- Housing Median Monthly Rent ($), by Zip Code (ZCTA5) — Washington
- Household Average Size by Zip Code (ZCTA5) — Washington
- Housing Owner-Occupied % of Units, by Zip Code (ZCTA5) — Washington
- Housing % of Units Built Since 2010, by Zip Code (ZCTA5) — Washington
- Housing Owner-Occupied Median Value ($), by Zip Code (ZCTA5) — Washington
- Housing Vacancy Rate by Zip Code (ZCTA5) — Washington
- % of Population without Health Insurance, by Zip Code (ZCTA5) — Washington
- Housing Vacancy Rate by Zip Code (ZCTA5) — Maine
- Population Hispanic % by County
- High School Graduate (% of Over 25) by Zip Code (ZCTA5) — Los Angeles Metro
- Population Non-Hispanic American Indian % by Zip Code (ZCTA5) — Los Angeles Metro
- Median Age by Zip Code (ZCTA5) — Los Angeles Metro
- Population Hispanic % by Zip Code (ZCTA5) — Los Angeles Metro
- Household Median Income by Zip Code (ZCTA5) — Los Angeles Metro
- U.S. Citizens (% of Population Over 18) by Zip Code (ZCTA5) — Los Angeles Metro
- % of Population on Food Stamps or SNAP (Last 12 Months), by Zip Code (ZCTA5) — New York Metro
- Population Non-Hispanic White % by Zip Code (ZCTA5) — Los Angeles Metro
- Household Average Size by Zip Code (ZCTA5) — Virginia
- Housing Median Monthly Rent ($), by Zip Code (ZCTA5) — Virginia
- Married Couple (% of all Households) by Zip Code (ZCTA5) — Virginia
- High School Graduate (% of Over 25) by Zip Code (ZCTA5) — Virginia
- Population Non-Hispanic American Indian % by Zip Code (ZCTA5) — Virginia
- Bachelor's Degree or Higher (% of Over 25) by Zip Code (ZCTA5) — Virginia
- Housing Owner-Occupied % of Units, by Zip Code (ZCTA5) — Virginia
- Housing Owner-Occupied Median Value ($), by Zip Code (ZCTA5) — Virginia
- Housing % of Units Built Since 2010, by Zip Code (ZCTA5) — Virginia
- Population Hispanic % by Zip Code (ZCTA5) — Virginia
- % of Households with Broadband Internet, by Zip Code (ZCTA5) — Washington D.C.
- % of Households with Broadband Internet, by Zip Code (ZCTA5) — Washington D.C. Metro
- % of Households with Broadband Internet, by Zip Code (ZCTA5) — Oregon
- % of Households with Broadband Internet, by Zip Code (ZCTA5) — Iowa
- % of Households with Broadband Internet, by Zip Code (ZCTA5) — Ohio
- % of Households with Broadband Internet, by Zip Code (ZCTA5) — Wyoming
- % of Households with Broadband Internet, by Zip Code (ZCTA5) — Idaho
- % of Households with Broadband Internet, by Zip Code (ZCTA5) — Utah
- % of Households with Broadband Internet, by Zip Code (ZCTA5) — Houston Metro
- % of Households with Broadband Internet, by Zip Code (ZCTA5) — Texas