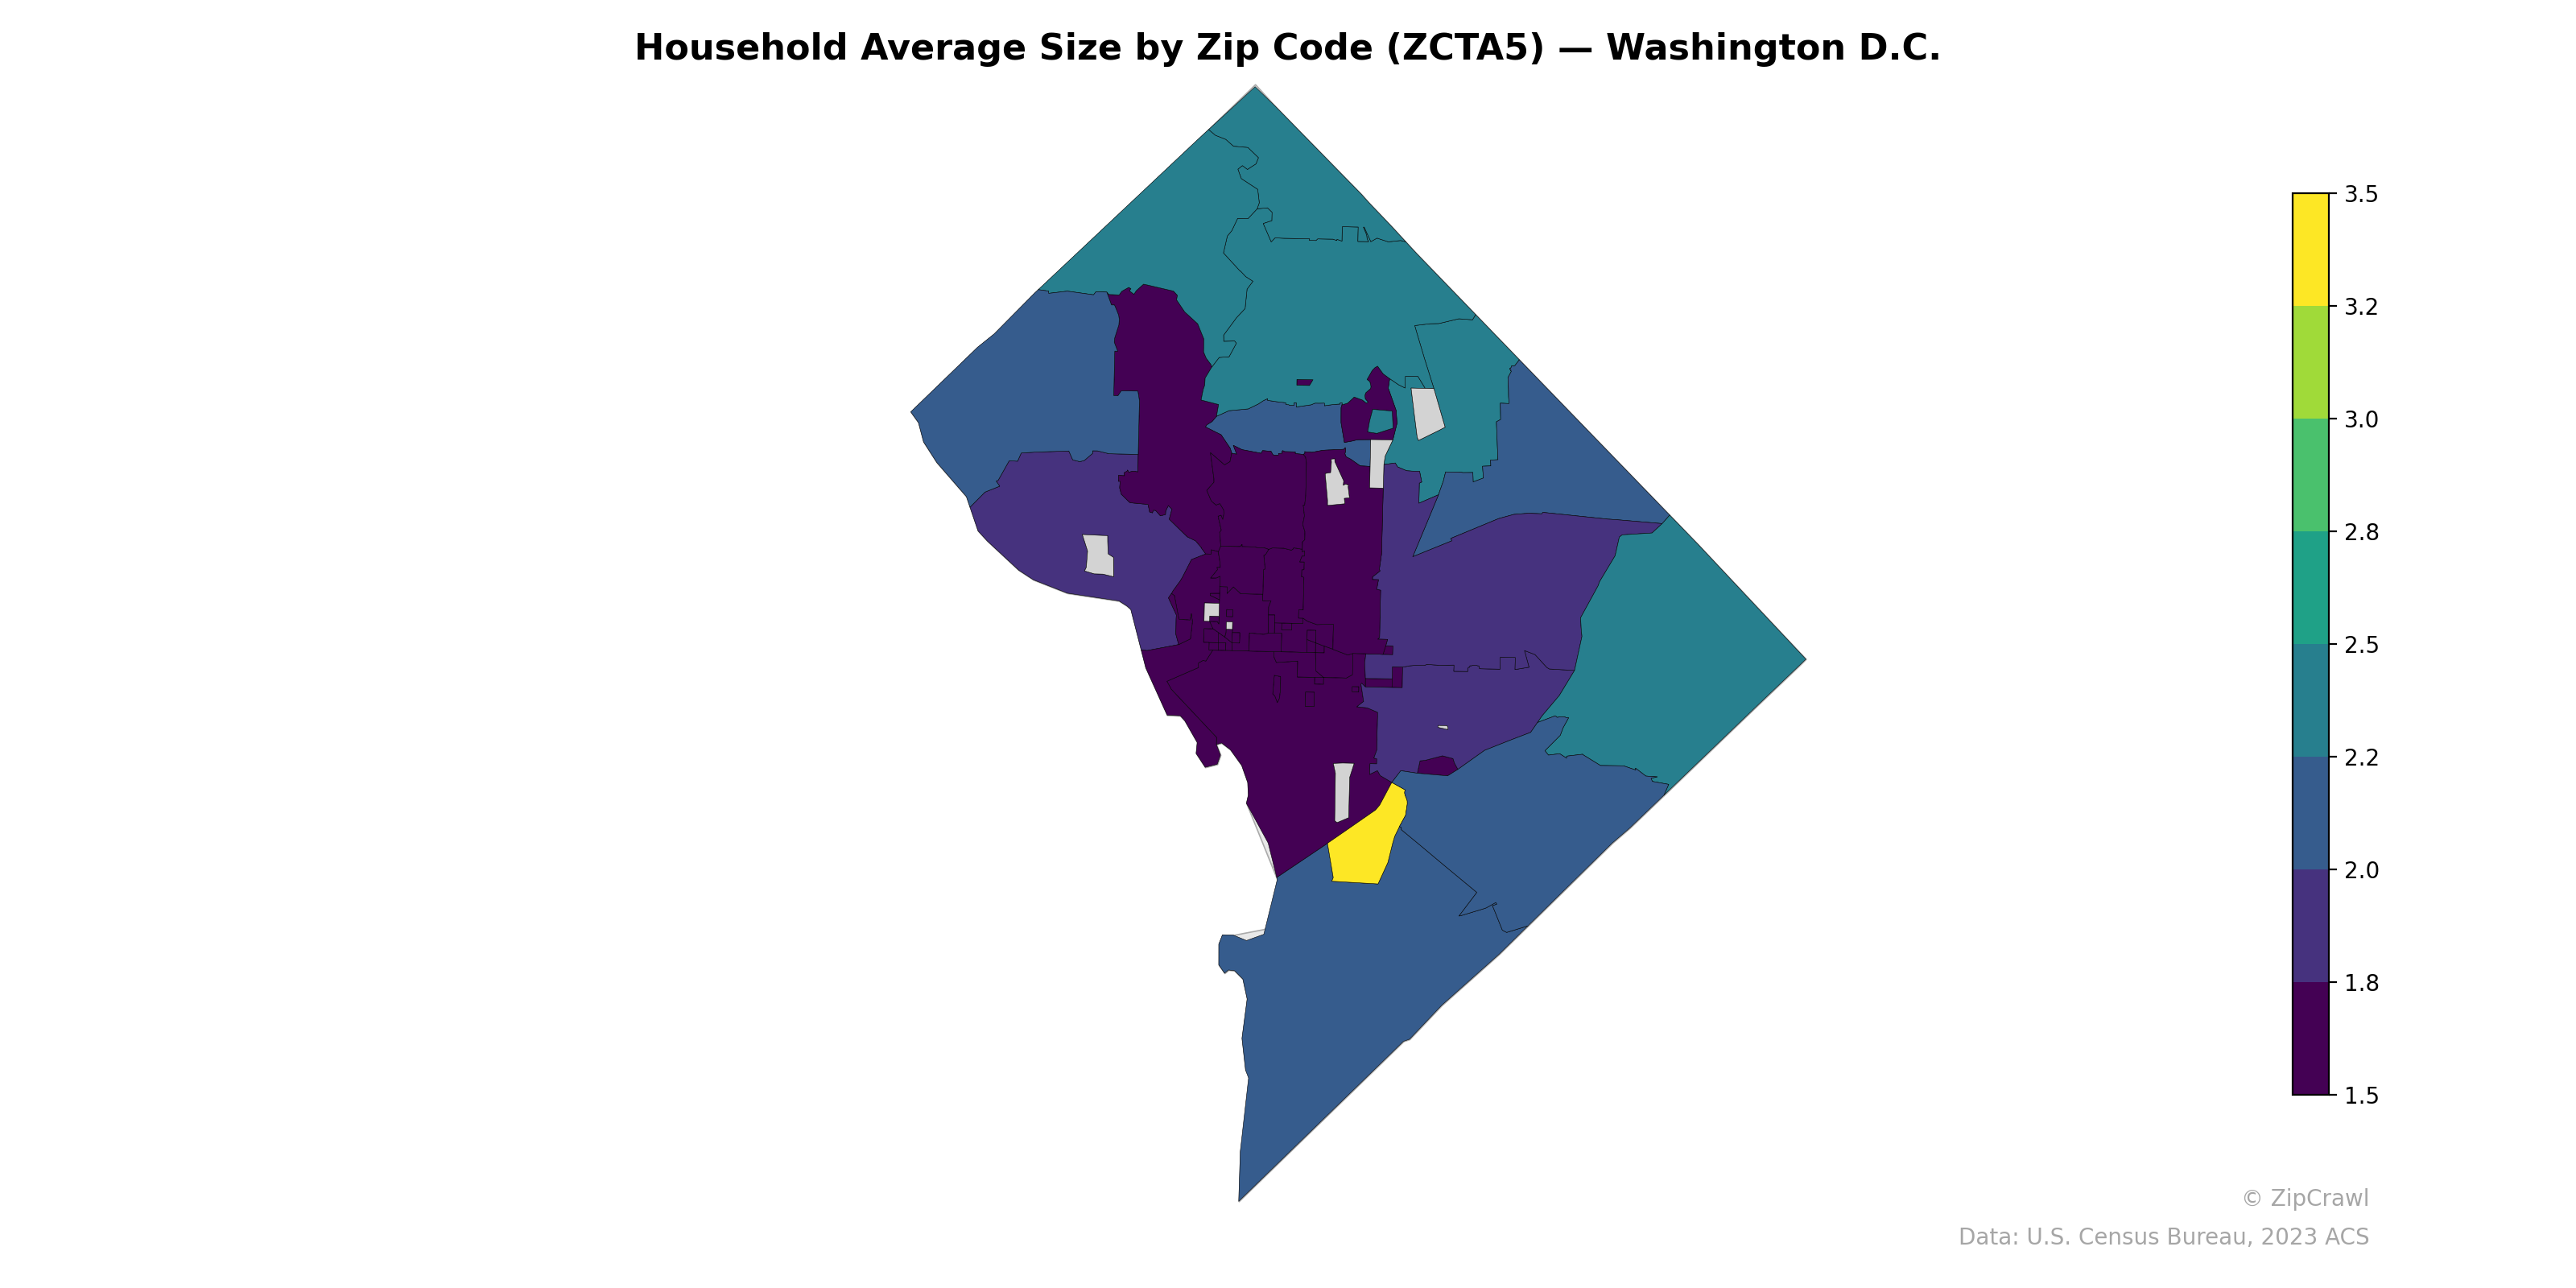
NOTE: Gray indicates insufficient data or a suppressed estimate.
Household sizes in Washington D.C. exhibit a clear northwest-to-southeast gradient, with the largest average households (3.0–3.5 persons) concentrated in the northeastern and far southeastern zip codes, likely corresponding to more family-oriented neighborhoods such as those east of the Anacostia River. The central and northwestern core of the district—encompassing areas like Dupont Circle, Adams Morgan, and downtown—consistently registers the smallest household sizes (1.5–2.0), reflecting a predominance of single-occupant and young professional households. A notable outlier appears in the south-central portion of the map, where one zip code reaches the highest values on the scale (approximately 3.5), standing in stark contrast to the surrounding low-density household areas.
Data: U.S. Census Bureau, 2023 ACS
Explore
- Median Age by Zip Code (ZCTA5) — Illinois
- Housing Owner-Occupied Median Value ($), by Zip Code (ZCTA5) — Washington D.C.
- Population Non-Hispanic American Indian % by Zip Code (ZCTA5) — Washington D.C.
- Bachelor's Degree or Higher (% of Over 25) by Zip Code (ZCTA5) — Washington D.C.
- Housing Median Monthly Rent ($), by Zip Code (ZCTA5) — Washington D.C.
- Housing % of Units Built Since 2010, by Zip Code (ZCTA5) — Washington D.C.
- Housing Owner-Occupied % of Units, by Zip Code (ZCTA5) — Washington D.C.
- % of Population without Health Insurance, by Zip Code (ZCTA5) — Washington D.C.
- % of Households with Broadband Internet, by Zip Code (ZCTA5) — Washington D.C.
- High School Graduate (% of Over 25) by Zip Code (ZCTA5) — Washington D.C.
- Married Couple (% of all Households) by County
- Population Non-Hispanic American Indian % by Zip Code (ZCTA5) — Illinois
- High School Graduate (% of Over 25) by Zip Code (ZCTA5) — Illinois
- Population Non-Hispanic Black % by Zip Code (ZCTA5) — Illinois
- High School Graduate (% of Over 25) by Zip Code (ZCTA5) — New York
- Household Median Income by Zip Code (ZCTA5) — Illinois
- Population Non-Hispanic White % by Zip Code (ZCTA5) — Illinois
- Population Non-Hispanic Asian % by Zip Code (ZCTA5) — New York
- % of Population on Food Stamps or SNAP (Last 12 Months), by Zip Code (ZCTA5) — New York
- U.S. Citizens (% of Population Over 18) by Zip Code (ZCTA5) — Illinois
- Population Hispanic % by Zip Code (ZCTA5) — Illinois
- High School Graduate (% of Over 25) by Zip Code (ZCTA5) — Detroit Metro
- Population Non-Hispanic American Indian % by Zip Code (ZCTA5) — Vermont
- Bachelor's Degree or Higher (% of Over 25) by Zip Code (ZCTA5) — Vermont
- Population Non-Hispanic Asian % by Zip Code (ZCTA5) — Vermont
- Population Hispanic % by Zip Code (ZCTA5) — Washington D.C.
- High School Graduate (% of Over 25) by Zip Code (ZCTA5) — Vermont
- % of Population without Health Insurance, by Zip Code (ZCTA5) — Oregon
- Married Couple (% of all Households) by Zip Code (ZCTA5) — Vermont
- % of Households with Broadband Internet, by Zip Code (ZCTA5) — Vermont
- Household Average Size by Zip Code (ZCTA5) — Washington
- Household Average Size by Zip Code (ZCTA5) — Washington D.C. Metro
- Household Average Size by Zip Code (ZCTA5) — Wyoming
- Household Average Size by Zip Code (ZCTA5) — Oregon
- Household Average Size by Zip Code (ZCTA5) — Iowa
- Household Average Size by Zip Code (ZCTA5) — Ohio
- Household Average Size by Zip Code (ZCTA5) — Utah
- Household Average Size by Zip Code (ZCTA5) — Houston Metro
- Household Average Size by Zip Code (ZCTA5) — Idaho
- Household Average Size by Zip Code (ZCTA5) — Texas