NOTE: Gray indicates insufficient data or a suppressed estimate.
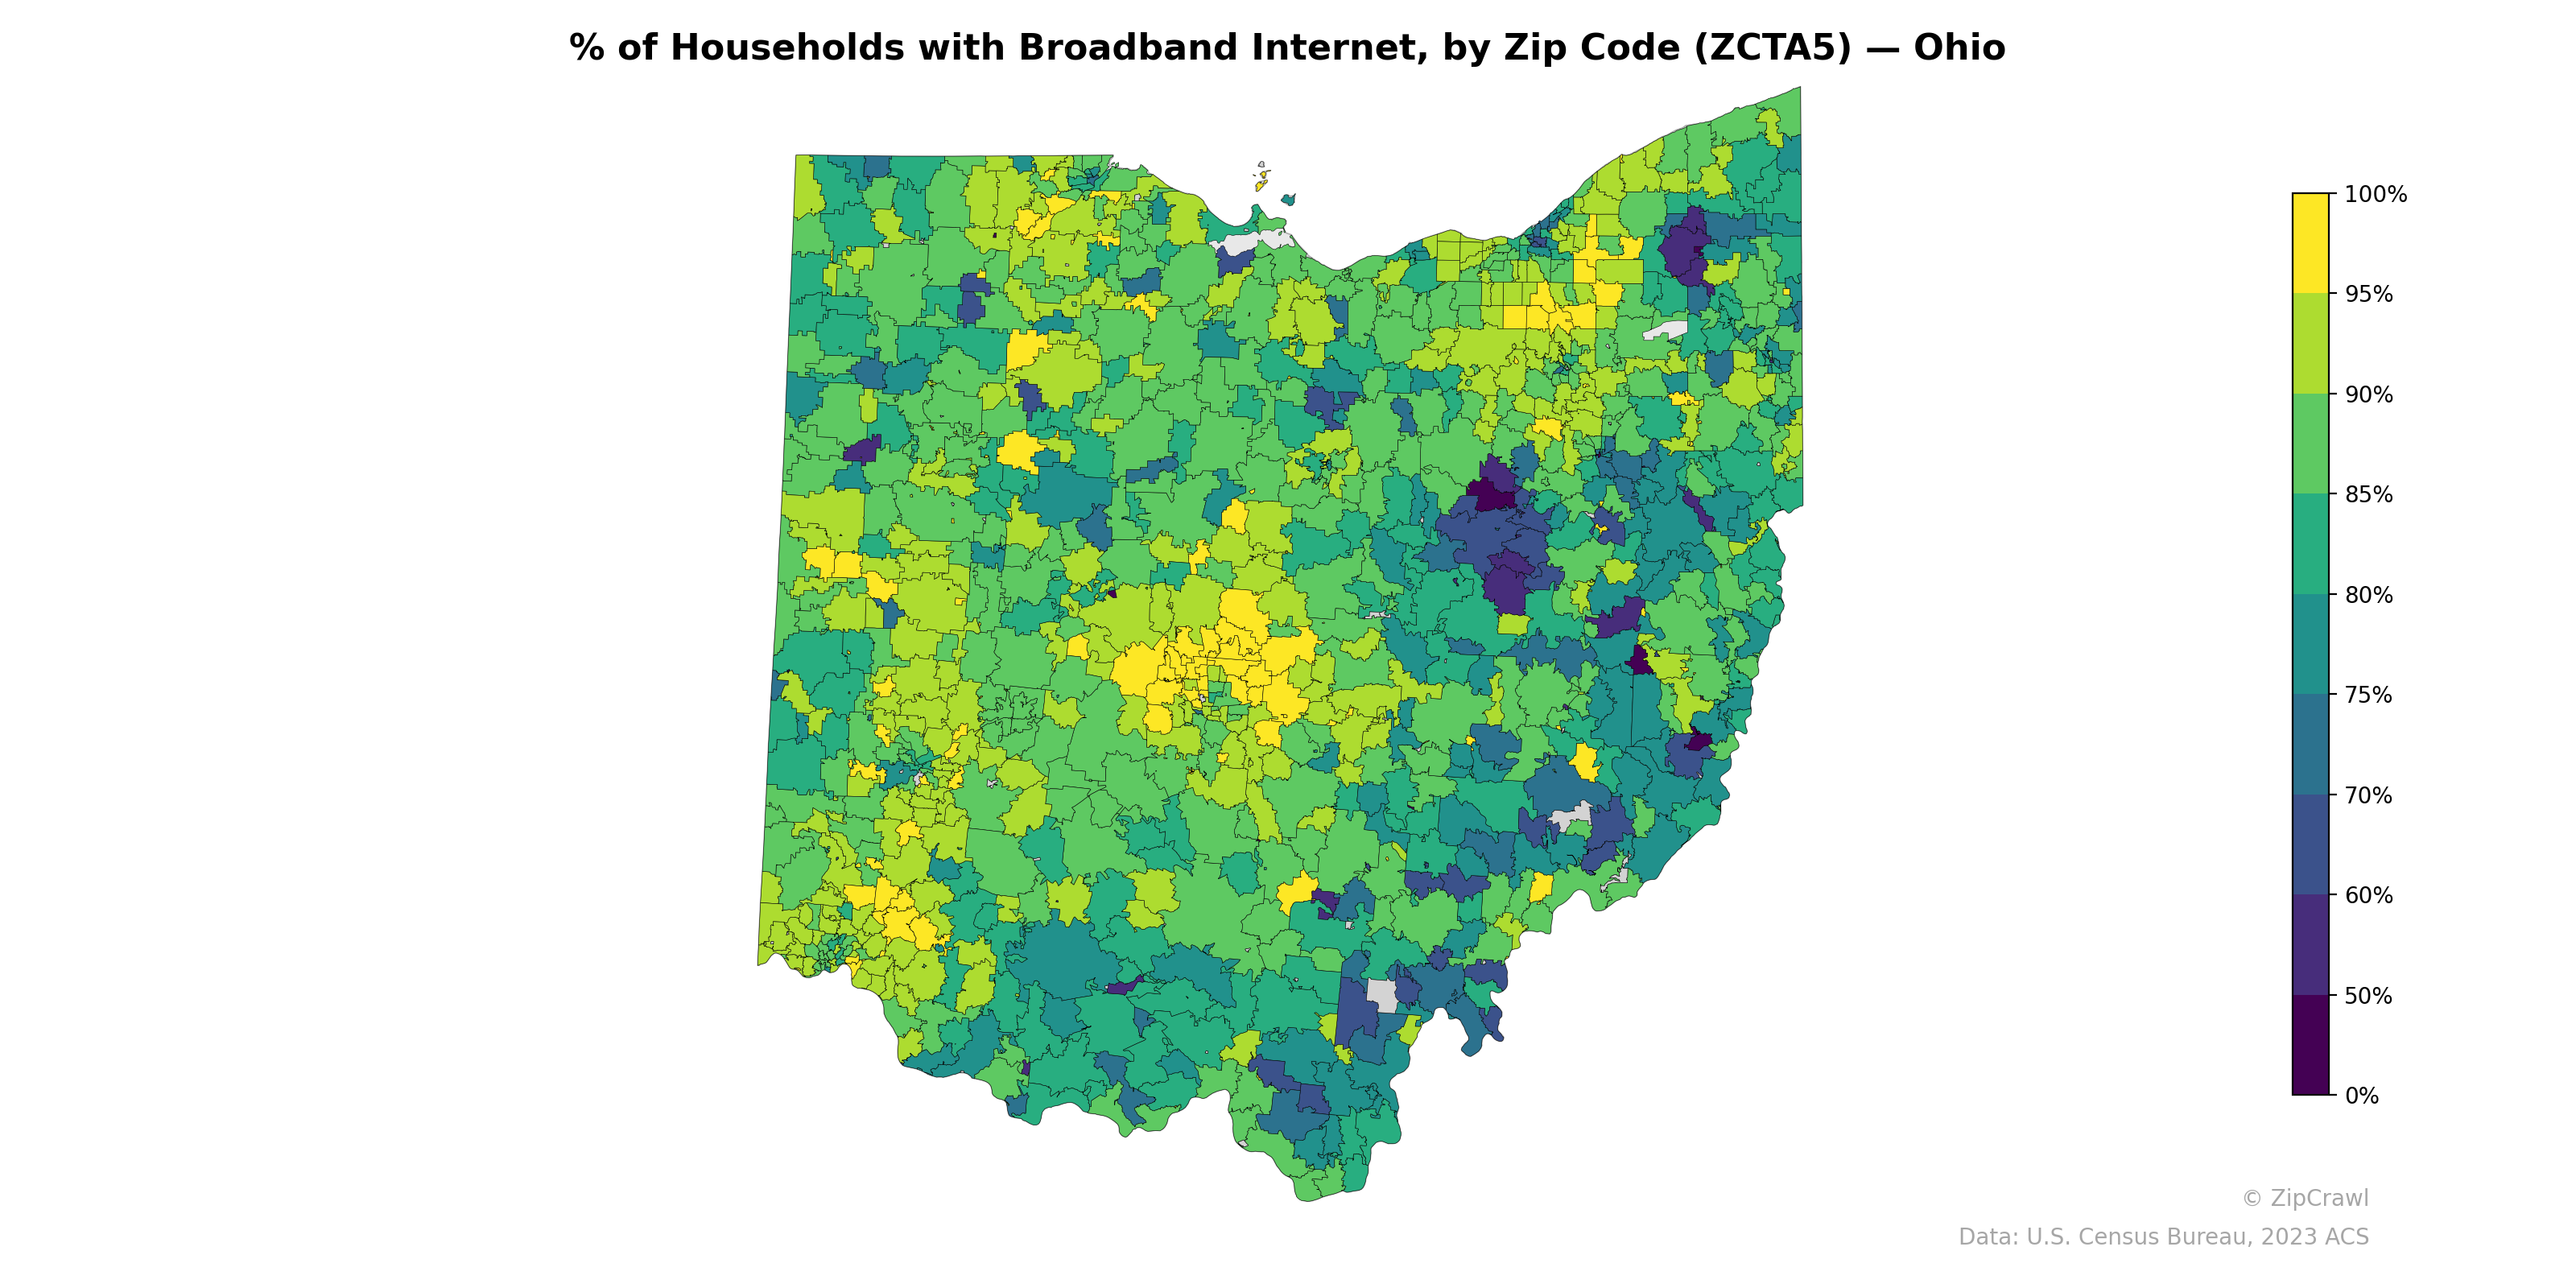
Broadband adoption rates across Ohio exhibit a clear urban-suburban divide, with the highest penetration (90–100%) concentrated in suburban zip codes ringing Columbus, Cincinnati, and Cleveland, while many urban core zip codes in those same metros—particularly in Cleveland's east side and parts of Youngstown—drop below 60%. The southeastern Appalachian region of the state consistently registers lower broadband rates, generally in the 65–80% range, reflecting persistent rural connectivity challenges. A notable corridor of high adoption stretches across the northwestern quadrant of the state, where smaller metro areas and agricultural communities appear to maintain relatively strong broadband access compared to their southeastern counterparts.
Data: U.S. Census Bureau, 2023 ACS
Explore
- U.S. Citizens (% of Population Over 18) by Zip Code (ZCTA5) — New York Metro
- Housing Vacancy Rate by Zip Code (ZCTA5) — Ohio
- Housing Owner-Occupied % of Units, by Zip Code (ZCTA5) — Ohio
- % of Population without Health Insurance, by Zip Code (ZCTA5) — Ohio
- Bachelor's Degree or Higher (% of Over 25) by Zip Code (ZCTA5) — Ohio
- Housing Owner-Occupied Median Value ($), by Zip Code (ZCTA5) — Ohio
- Household Average Size by Zip Code (ZCTA5) — Ohio
- Housing Median Monthly Rent ($), by Zip Code (ZCTA5) — Ohio
- Married Couple (% of all Households) by Zip Code (ZCTA5) — Ohio
- Housing % of Units Built Since 2010, by Zip Code (ZCTA5) — Ohio
- Housing Vacancy Rate by Zip Code (ZCTA5) — Connecticut
- Median Age by County
- Population Non-Hispanic White % by Zip Code (ZCTA5) — New York Metro
- High School Graduate (% of Over 25) by Zip Code (ZCTA5) — New York Metro
- Housing Owner-Occupied % of Units, by County
- % of Population on Food Stamps or SNAP (Last 12 Months), by County
- Median Age by Zip Code (ZCTA5) — New York Metro
- Population Non-Hispanic Black % by Zip Code (ZCTA5) — New York Metro
- Bachelor's Degree or Higher (% of Over 25) by Zip Code (ZCTA5) — New York Metro
- Household Median Income by Zip Code (ZCTA5) — New York Metro
- Population Non-Hispanic American Indian % by Zip Code (ZCTA5) — New York Metro
- Population Hispanic % by Zip Code (ZCTA5) — New York Metro
- Population Non-Hispanic Black % by Zip Code (ZCTA5) — Ohio
- High School Graduate (% of Over 25) by Zip Code (ZCTA5) — Ohio
- Median Age by Zip Code (ZCTA5) — Ohio
- Household Median Income by Zip Code (ZCTA5) — Ohio
- Population Non-Hispanic White % by Zip Code (ZCTA5) — Ohio
- Population Non-Hispanic American Indian % by Zip Code (ZCTA5) — Ohio
- % of Population on Food Stamps or SNAP (Last 12 Months), by Zip Code (ZCTA5) — Pennsylvania
- U.S. Citizens (% of Population Over 18) by Zip Code (ZCTA5) — Ohio
- % of Households with Broadband Internet, by Zip Code (ZCTA5) — Iowa
- % of Households with Broadband Internet, by Zip Code (ZCTA5) — Utah
- % of Households with Broadband Internet, by Zip Code (ZCTA5) — Idaho
- % of Households with Broadband Internet, by Zip Code (ZCTA5) — Texas
- % of Households with Broadband Internet, by Zip Code (ZCTA5) — Indiana
- % of Households with Broadband Internet, by Zip Code (ZCTA5) — Maine
- % of Households with Broadband Internet, by Zip Code (ZCTA5) — Hawaii
- % of Households with Broadband Internet, by Zip Code (ZCTA5) — Oregon
- % of Households with Broadband Internet, by Zip Code (ZCTA5) — Maryland
- % of Households with Broadband Internet, by Zip Code (ZCTA5) — Kansas