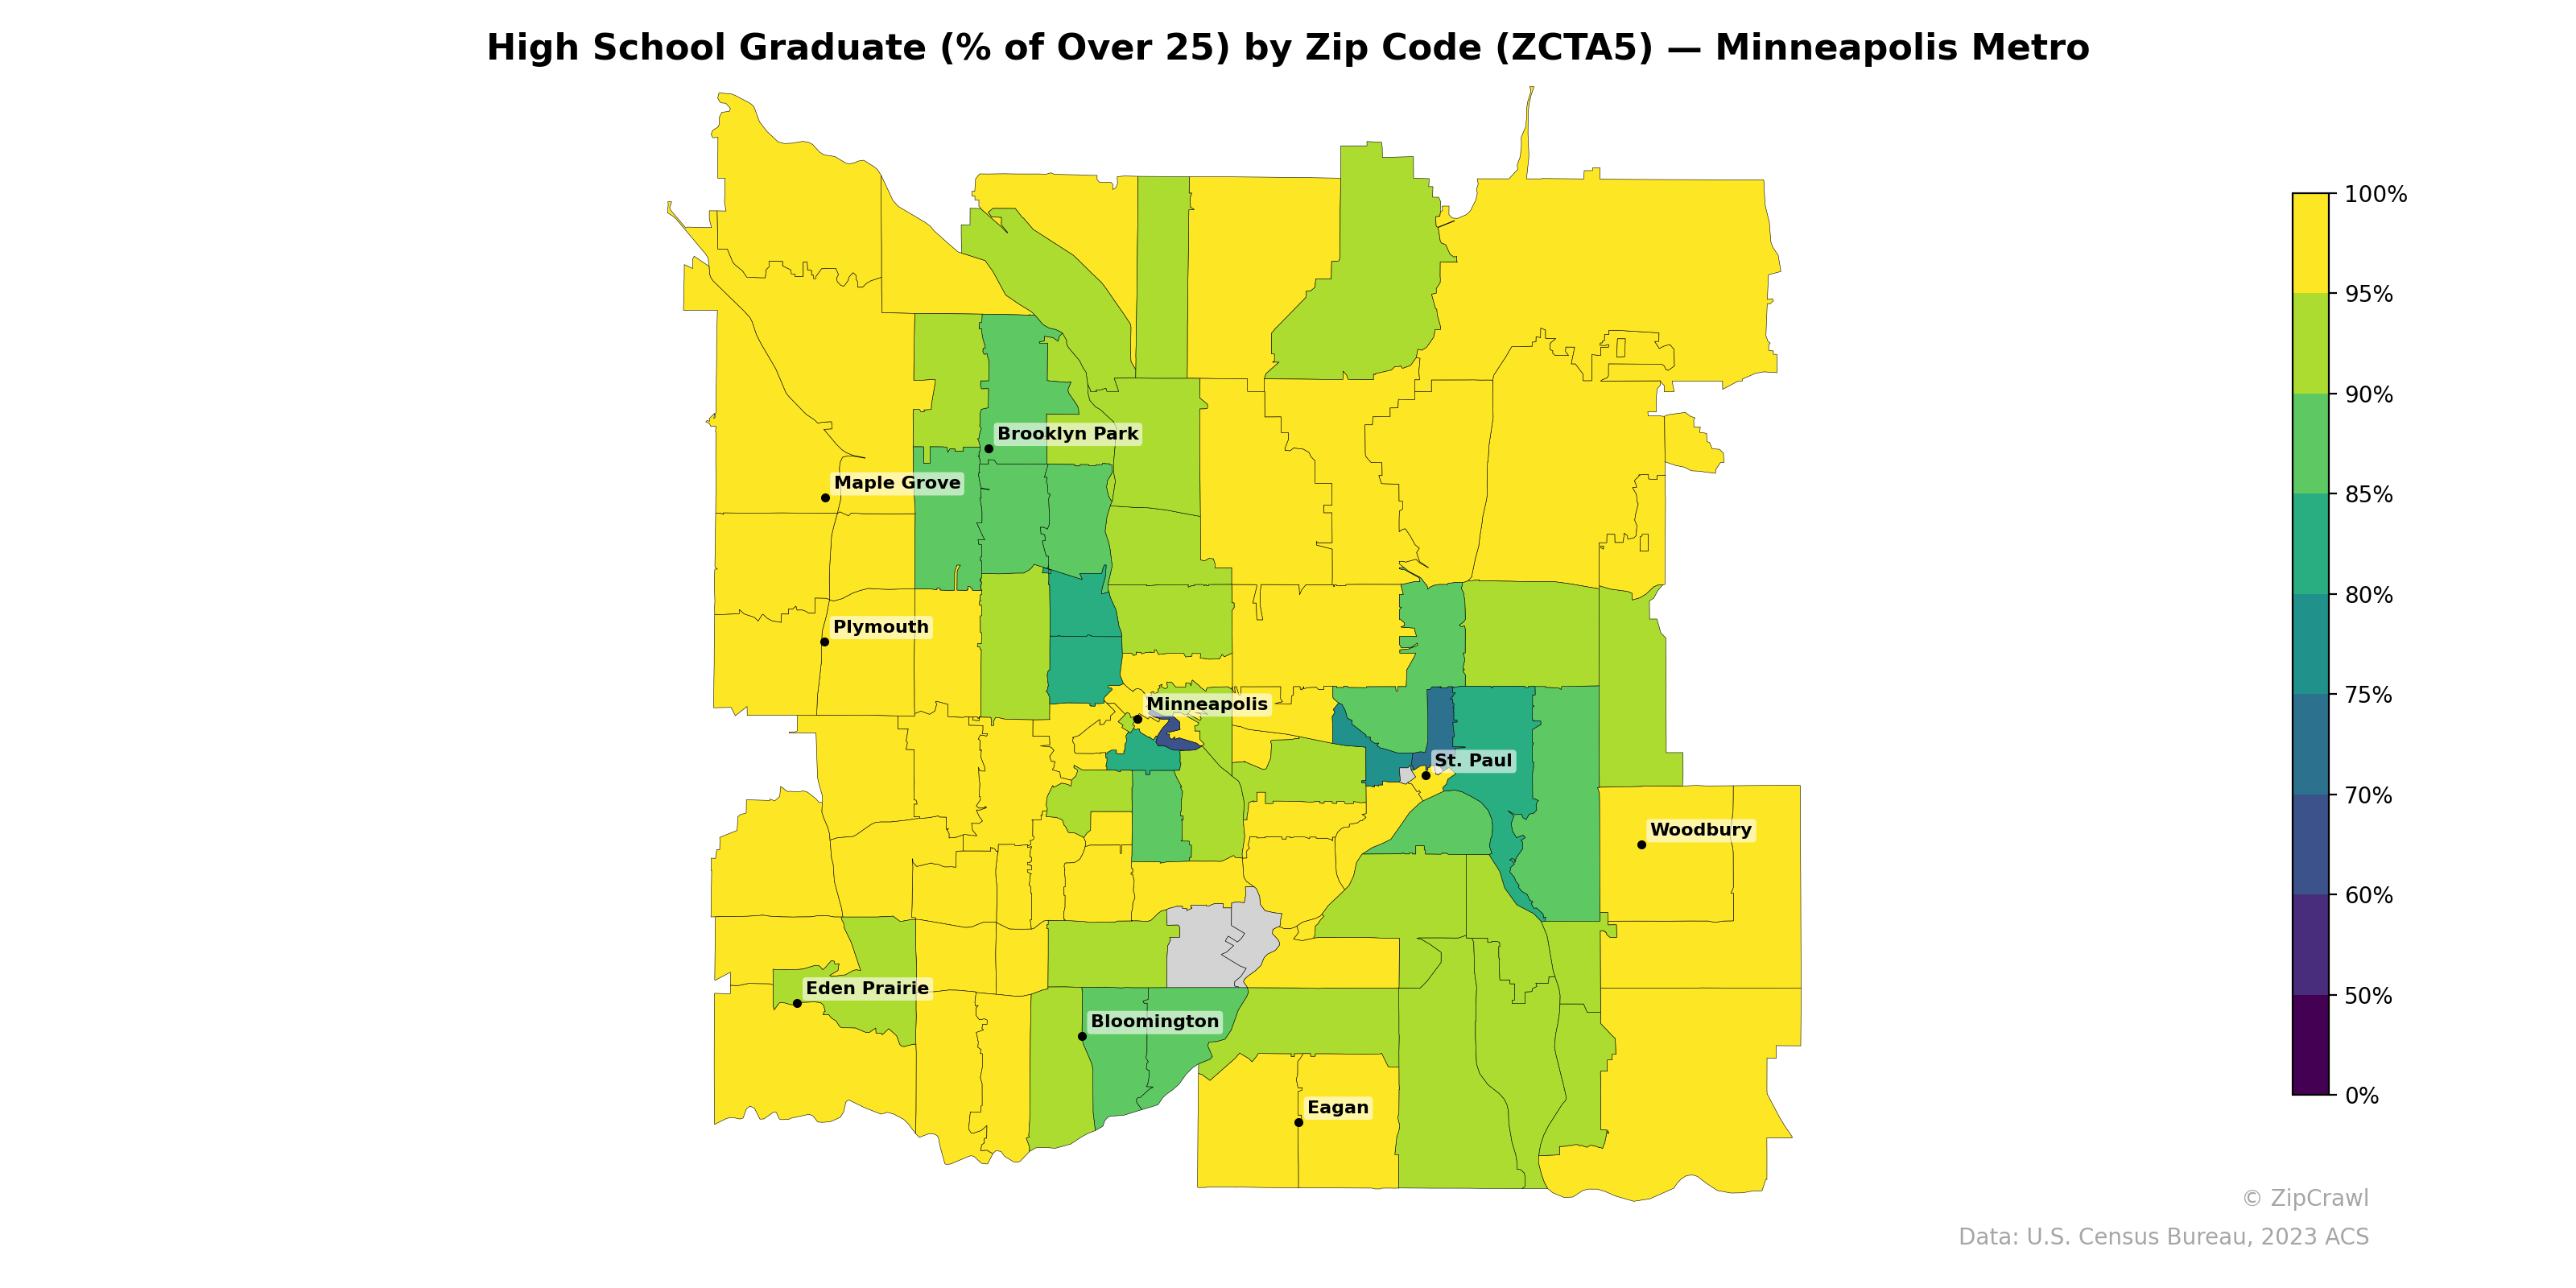
NOTE: Gray indicates insufficient data or a suppressed estimate.
High school graduation rates across the Minneapolis metro area are generally high, with most suburban zip codes in Plymouth, Maple Grove, Eden Prairie, Woodbury, and Eagan exceeding 95%, reflected in their bright yellow shading. A distinct corridor of lower graduation rates (roughly 60–80%) runs through the urban cores of Minneapolis and St. Paul, with the lowest concentrations appearing in north Minneapolis, central Minneapolis near downtown, and parts of the East Side and Frogtown neighborhoods of St. Paul. Brooklyn Park also stands out among the inner-ring suburbs with noticeably lower rates compared to its western and northern neighbors, suggesting demographic and socioeconomic divides that closely track the metro's historical patterns of residential segregation.
Data: U.S. Census Bureau, 2023 ACS
Explore
- Population Non-Hispanic American Indian % by Zip Code (ZCTA5) — Chicago Metro
- Population Non-Hispanic American Indian % by Zip Code (ZCTA5) — Minneapolis Metro
- Median Age by Zip Code (ZCTA5) — Minneapolis Metro
- U.S. Citizens (% of Population Over 18) by Zip Code (ZCTA5) — Minneapolis Metro
- Population Hispanic % by Zip Code (ZCTA5) — Minneapolis Metro
- Household Median Income by Zip Code (ZCTA5) — Minneapolis Metro
- Population Non-Hispanic White % by Zip Code (ZCTA5) — Minneapolis Metro
- Population Non-Hispanic Black % by Zip Code (ZCTA5) — Minneapolis Metro
- % of Population on Food Stamps or SNAP (Last 12 Months), by Zip Code (ZCTA5) — Seattle Metro
- Population Non-Hispanic Asian % by Zip Code (ZCTA5) — Seattle Metro
- % of Population without Health Insurance, by County
- Population Non-Hispanic White % by Zip Code (ZCTA5) — Chicago Metro
- Median Age by Zip Code (ZCTA5) — Chicago Metro
- U.S. Citizens (% of Population Over 18) by Zip Code (ZCTA5) — Chicago Metro
- Household Median Income by Zip Code (ZCTA5) — Chicago Metro
- Population Non-Hispanic Black % by Zip Code (ZCTA5) — Chicago Metro
- Population Non-Hispanic Asian % by Zip Code (ZCTA5) — Los Angeles Metro
- % of Population on Food Stamps or SNAP (Last 12 Months), by Zip Code (ZCTA5) — Los Angeles Metro
- Population Hispanic % by Zip Code (ZCTA5) — Chicago Metro
- Housing % of Units Built Since 2010, by Zip Code (ZCTA5) — Boston Metro
- Housing Owner-Occupied Median Value ($), by Zip Code (ZCTA5) — Boston Metro
- Household Average Size by Zip Code (ZCTA5) — Boston Metro
- Population Non-Hispanic Black % by Zip Code (ZCTA5) — Boston Metro
- Bachelor's Degree or Higher (% of Over 25) by Zip Code (ZCTA5) — Boston Metro
- Population Non-Hispanic White % by Zip Code (ZCTA5) — Boston Metro
- Population Non-Hispanic American Indian % by Zip Code (ZCTA5) — Boston Metro
- % of Population without Health Insurance, by Zip Code (ZCTA5) — Boston Metro
- Housing Owner-Occupied % of Units, by Zip Code (ZCTA5) — Boston Metro
- Housing Median Monthly Rent ($), by Zip Code (ZCTA5) — Boston Metro
- Median Age by Zip Code (ZCTA5) — Boston Metro
- High School Graduate (% of Over 25) by Zip Code (ZCTA5) — Miami Metro
- High School Graduate (% of Over 25) by Zip Code (ZCTA5) — Denver Metro
- High School Graduate (% of Over 25) by Zip Code (ZCTA5) — St. Louis Metro
- High School Graduate (% of Over 25) by Zip Code (ZCTA5) — Boston Metro
- High School Graduate (% of Over 25) by Zip Code (ZCTA5) — Tampa Metro
- High School Graduate (% of Over 25) by Zip Code (ZCTA5) — Detroit Metro
- High School Graduate (% of Over 25) by Zip Code (ZCTA5) — Minnesota
- High School Graduate (% of Over 25) by Zip Code (ZCTA5) — Dallas Metro
- High School Graduate (% of Over 25) by Zip Code (ZCTA5) — Houston Metro
- High School Graduate (% of Over 25) by Zip Code (ZCTA5) — Seattle Metro