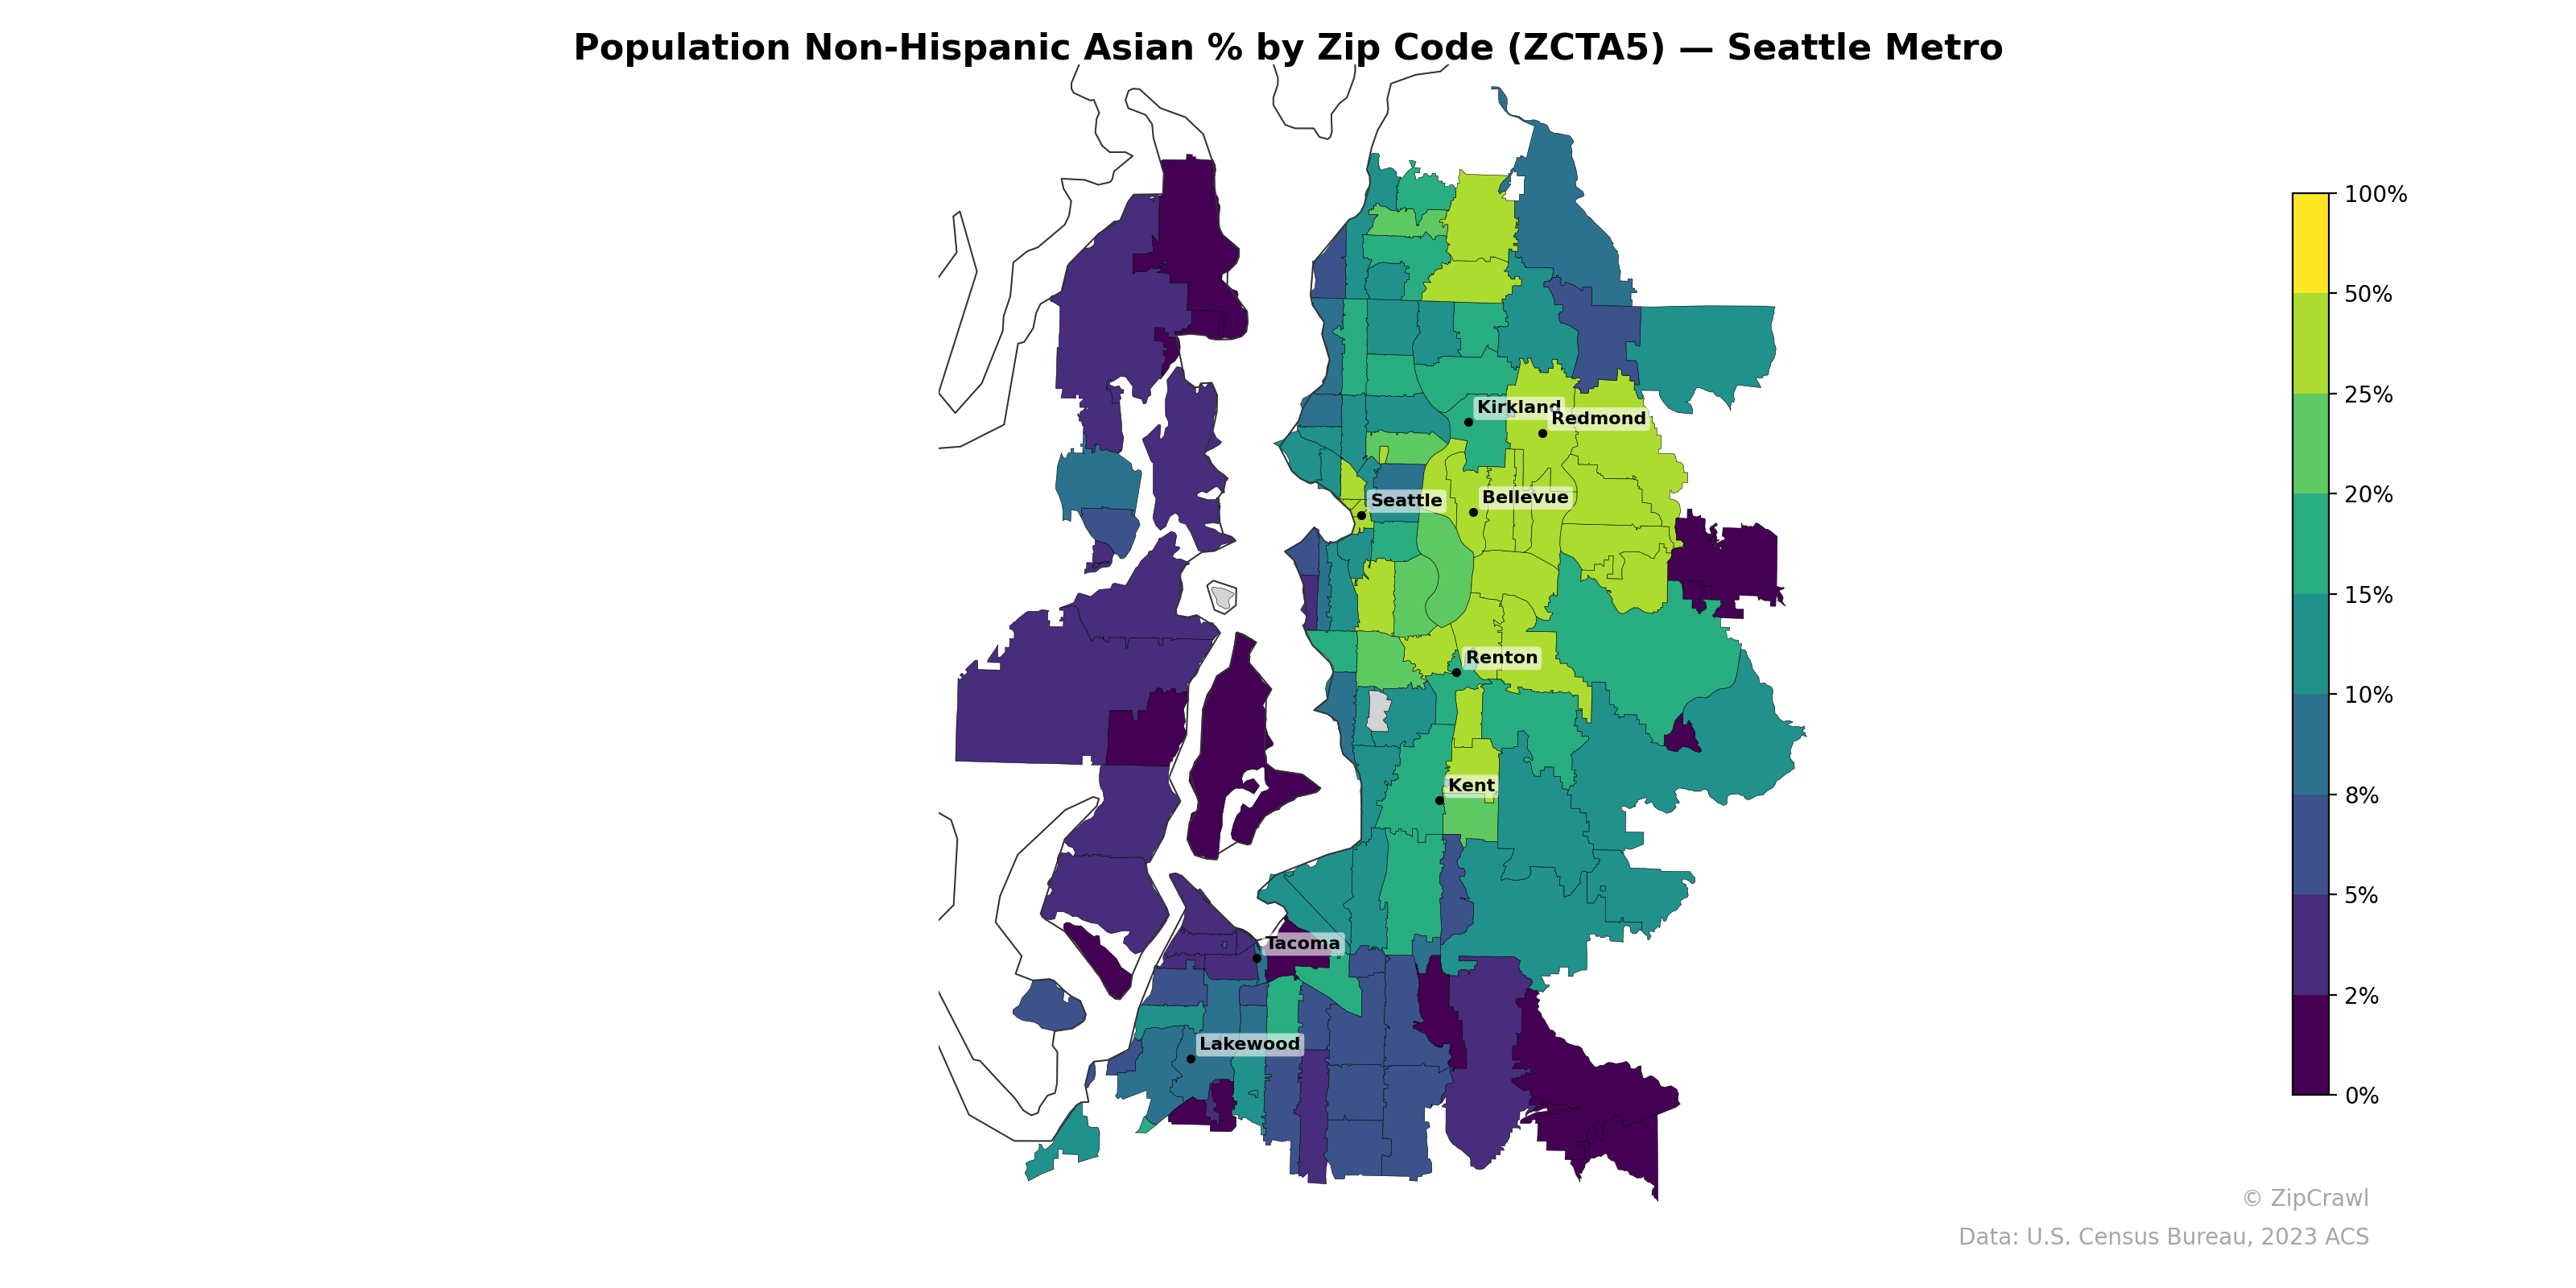
NOTE: Gray indicates insufficient data or a suppressed estimate.
The highest concentrations of non-Hispanic Asian residents, exceeding 25–50%, cluster along the Eastside corridor from Kirkland and Redmond south through Bellevue and into the Renton-Kent area, forming a distinct band east of Lake Washington. Western Seattle neighborhoods and the Tacoma-Lakewood area to the south display markedly lower percentages, generally falling below 8–10%, creating a sharp east-west demographic divide. Scattered zip codes with very low Asian population shares (under 2%) appear in the more rural or exurban periphery, particularly on the Kitsap Peninsula side and in pockets south of Tacoma.
Data: U.S. Census Bureau, 2023 ACS
Explore
- Population Non-Hispanic American Indian % by Zip Code (ZCTA5) — Chicago Metro
- High School Graduate (% of Over 25) by Zip Code (ZCTA5) — Minneapolis Metro
- U.S. Citizens (% of Population Over 18) by Zip Code (ZCTA5) — Minneapolis Metro
- % of Population on Food Stamps or SNAP (Last 12 Months), by Zip Code (ZCTA5) — Seattle Metro
- Population Non-Hispanic Black % by Zip Code (ZCTA5) — Minneapolis Metro
- Population Hispanic % by Zip Code (ZCTA5) — Minneapolis Metro
- Population Non-Hispanic American Indian % by Zip Code (ZCTA5) — Minneapolis Metro
- Population Non-Hispanic White % by Zip Code (ZCTA5) — Minneapolis Metro
- Median Age by Zip Code (ZCTA5) — Minneapolis Metro
- Household Median Income by Zip Code (ZCTA5) — Minneapolis Metro
- % of Population without Health Insurance, by County
- U.S. Citizens (% of Population Over 18) by Zip Code (ZCTA5) — Chicago Metro
- High School Graduate (% of Over 25) by Zip Code (ZCTA5) — Chicago Metro
- Household Median Income by Zip Code (ZCTA5) — Chicago Metro
- Median Age by Zip Code (ZCTA5) — Chicago Metro
- % of Population on Food Stamps or SNAP (Last 12 Months), by Zip Code (ZCTA5) — Los Angeles Metro
- Population Non-Hispanic White % by Zip Code (ZCTA5) — Chicago Metro
- Population Hispanic % by Zip Code (ZCTA5) — Chicago Metro
- Population Non-Hispanic Black % by Zip Code (ZCTA5) — Chicago Metro
- Housing Owner-Occupied % of Units, by Zip Code (ZCTA5) — Boston Metro
- % of Households with Broadband Internet, by Zip Code (ZCTA5) — Boston Metro
- Housing Owner-Occupied Median Value ($), by Zip Code (ZCTA5) — Boston Metro
- Median Age by Zip Code (ZCTA5) — Boston Metro
- Population Hispanic % by Zip Code (ZCTA5) — Boston Metro
- U.S. Citizens (% of Population Over 18) by Zip Code (ZCTA5) — Boston Metro
- Population Non-Hispanic White % by Zip Code (ZCTA5) — Boston Metro
- Population Non-Hispanic American Indian % by Zip Code (ZCTA5) — Boston Metro
- Bachelor's Degree or Higher (% of Over 25) by Zip Code (ZCTA5) — Boston Metro
- % of Population without Health Insurance, by Zip Code (ZCTA5) — Boston Metro
- Housing Owner-Occupied % of Units, by Zip Code (ZCTA5) — Seattle Metro
- Population Non-Hispanic Asian % by Zip Code (ZCTA5) — Boston Metro
- Population Non-Hispanic Asian % by Zip Code (ZCTA5) — Miami Metro
- Population Non-Hispanic Asian % by Zip Code (ZCTA5) — Austin Metro
- Population Non-Hispanic Asian % by Zip Code (ZCTA5) — Detroit Metro
- Population Non-Hispanic Asian % by Zip Code (ZCTA5) — Tampa Metro
- Population Non-Hispanic Asian % by Zip Code (ZCTA5) — Houston Metro
- Population Non-Hispanic Asian % by Zip Code (ZCTA5) — San Diego Metro
- Population Non-Hispanic Asian % by Zip Code (ZCTA5) — St. Louis Metro
- Population Non-Hispanic Asian % by Zip Code (ZCTA5) — Chicago Metro
- Population Non-Hispanic Asian % by Zip Code (ZCTA5) — Phoenix Metro