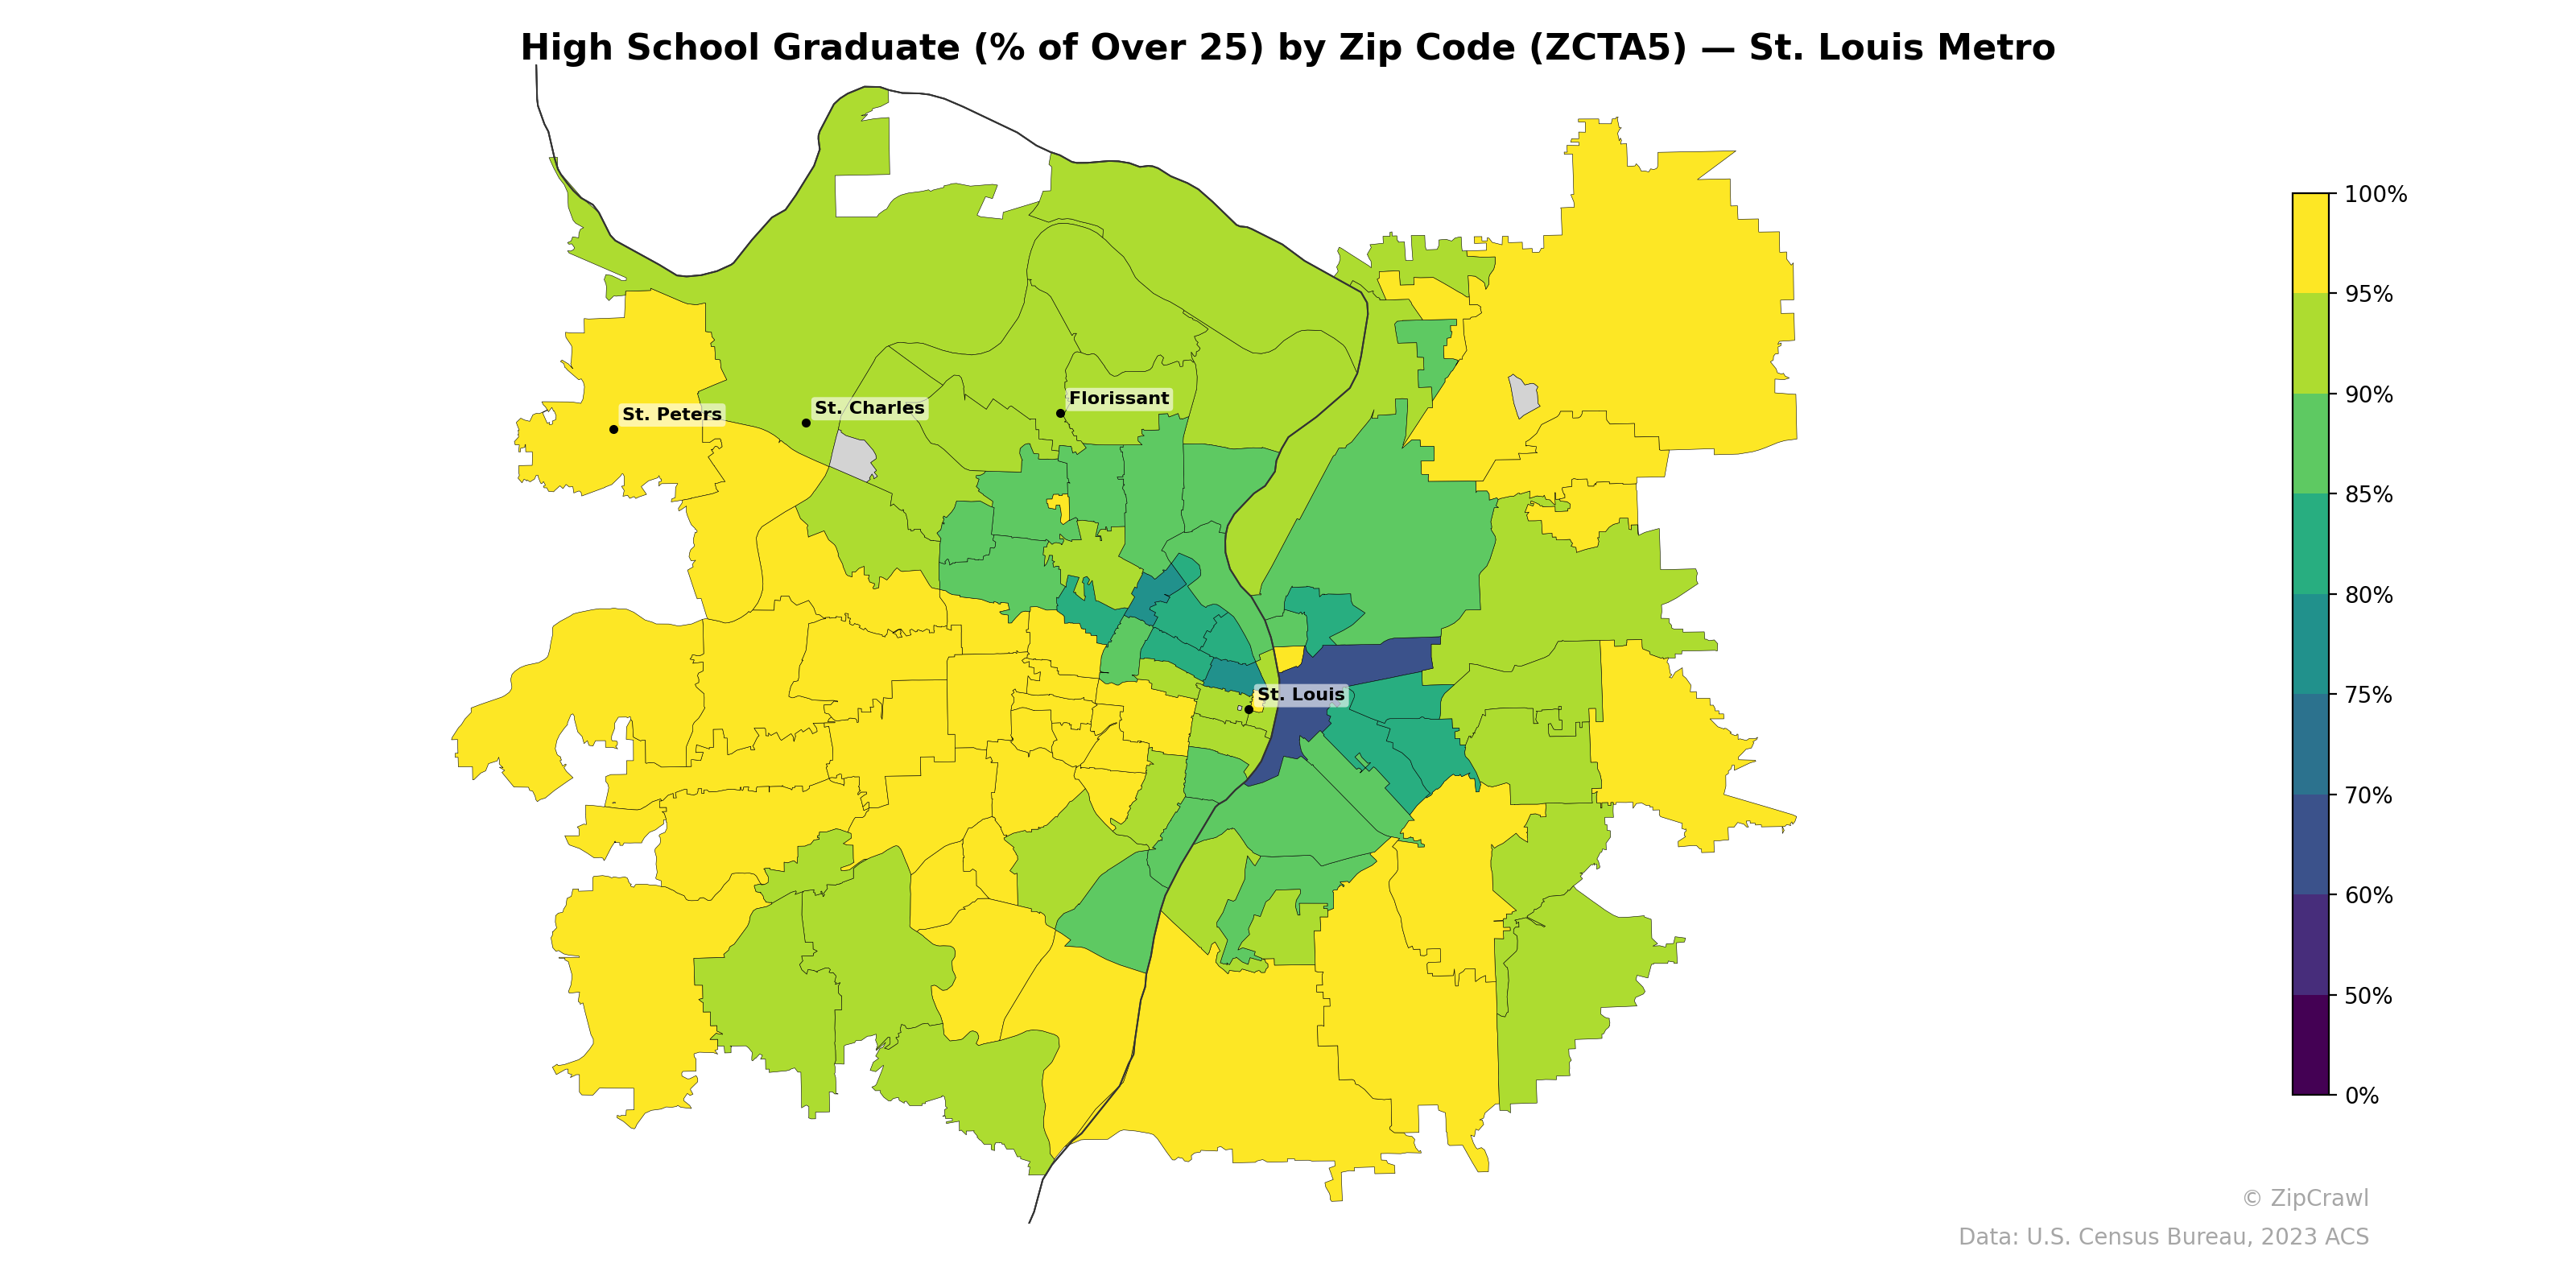
NOTE: Gray indicates insufficient data or a suppressed estimate.
High school graduation rates across the St. Louis metro area exhibit a stark urban-suburban divide, with outer suburban zip codes in St. Peters, St. Charles, and the western and southern periphery consistently reaching 95–100%, while central St. Louis City zip codes drop sharply to 50–70%. A corridor of lower attainment extends northward from downtown through Florissant and the near north suburbs, suggesting persistent educational disparities aligned with historically segregated neighborhoods. The eastern portions of the metro on the Illinois side and the far northeast also display notably mixed outcomes, contrasting with the uniformly high rates in the western exurban ring.
Data: U.S. Census Bureau, 2023 ACS
Explore
- U.S. Citizens (% of Population Over 18) by Zip Code (ZCTA5) — Texas
- Population Non-Hispanic Asian % by Zip Code (ZCTA5) — Baltimore Metro
- Population Non-Hispanic American Indian % by Zip Code (ZCTA5) — St. Louis Metro
- Household Median Income by Zip Code (ZCTA5) — St. Louis Metro
- Population Non-Hispanic Black % by Zip Code (ZCTA5) — St. Louis Metro
- Median Age by Zip Code (ZCTA5) — St. Louis Metro
- % of Population on Food Stamps or SNAP (Last 12 Months), by Zip Code (ZCTA5) — Baltimore Metro
- Population Non-Hispanic White % by Zip Code (ZCTA5) — St. Louis Metro
- Population Hispanic % by Zip Code (ZCTA5) — St. Louis Metro
- U.S. Citizens (% of Population Over 18) by Zip Code (ZCTA5) — St. Louis Metro
- Population Non-Hispanic White % by Zip Code (ZCTA5) — Texas
- Bachelor's Degree or Higher (% of Over 25) by Zip Code (ZCTA5) — New York Metro
- Population Non-Hispanic Asian % by Zip Code (ZCTA5) — Chicago Metro
- Household Median Income by Zip Code (ZCTA5) — Texas
- Median Age by Zip Code (ZCTA5) — Texas
- Population Hispanic % by Zip Code (ZCTA5) — Texas
- Population Non-Hispanic Black % by Zip Code (ZCTA5) — Texas
- Population Non-Hispanic American Indian % by Zip Code (ZCTA5) — Texas
- % of Population on Food Stamps or SNAP (Last 12 Months), by Zip Code (ZCTA5) — Chicago Metro
- Housing Owner-Occupied % of Units, by Zip Code (ZCTA5) — Baltimore Metro
- % of Population without Health Insurance, by Zip Code (ZCTA5) — Baltimore Metro
- Housing Owner-Occupied Median Value ($), by Zip Code (ZCTA5) — Baltimore Metro
- % of Population on Food Stamps or SNAP (Last 12 Months), by Zip Code (ZCTA5) — Charlotte Metro
- Household Median Income by Zip Code (ZCTA5) — Baltimore Metro
- Population Non-Hispanic American Indian % by Zip Code (ZCTA5) — Baltimore Metro
- U.S. Citizens (% of Population Over 18) by Zip Code (ZCTA5) — Baltimore Metro
- % of Households with Broadband Internet, by Zip Code (ZCTA5) — Baltimore Metro
- Population Non-Hispanic Asian % by Zip Code (ZCTA5) — Charlotte Metro
- Bachelor's Degree or Higher (% of Over 25) by Zip Code (ZCTA5) — Baltimore Metro
- Housing Median Monthly Rent ($), by Zip Code (ZCTA5) — Baltimore Metro
- High School Graduate (% of Over 25) by Zip Code (ZCTA5) — Miami Metro
- High School Graduate (% of Over 25) by Zip Code (ZCTA5) — Denver Metro
- High School Graduate (% of Over 25) by Zip Code (ZCTA5) — Boston Metro
- High School Graduate (% of Over 25) by Zip Code (ZCTA5) — Tampa Metro
- High School Graduate (% of Over 25) by Zip Code (ZCTA5) — Detroit Metro
- High School Graduate (% of Over 25) by Zip Code (ZCTA5) — Louisiana
- High School Graduate (% of Over 25) by Zip Code (ZCTA5) — Dallas Metro
- High School Graduate (% of Over 25) by Zip Code (ZCTA5) — Houston Metro
- High School Graduate (% of Over 25) by Zip Code (ZCTA5) — Seattle Metro
- High School Graduate (% of Over 25) by Zip Code (ZCTA5) — Chicago Metro