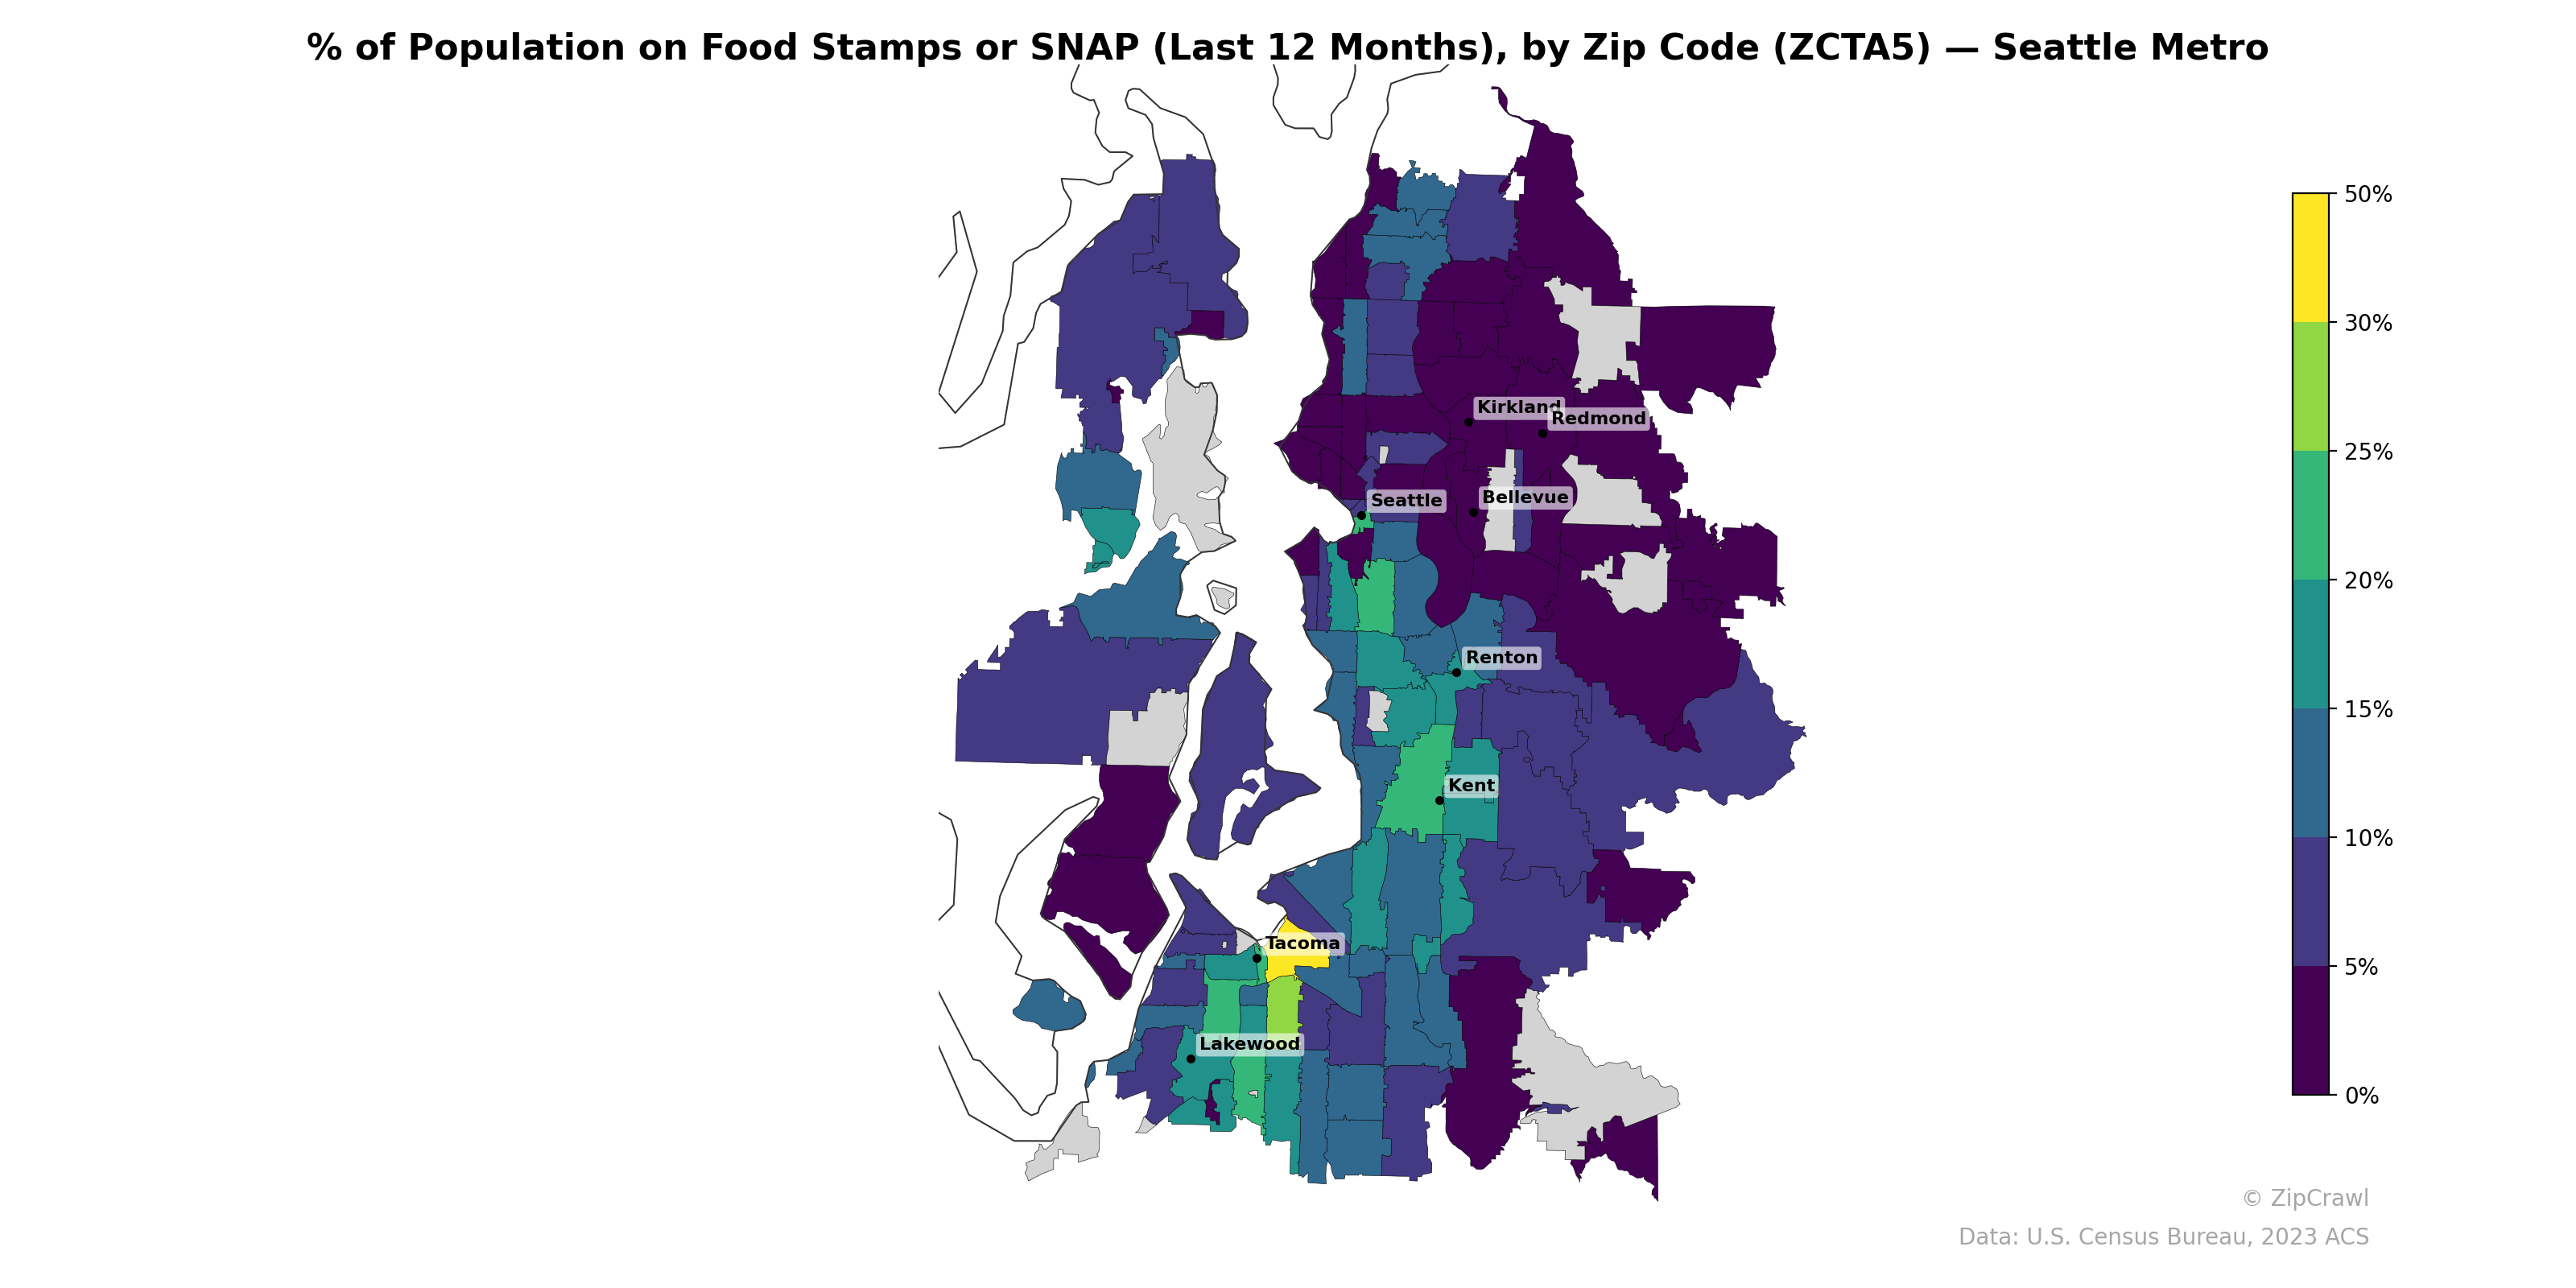
NOTE: Gray indicates insufficient data or a suppressed estimate.
The highest SNAP participation rates, exceeding 25–30%, concentrate in Tacoma and its immediate surroundings, particularly in zip codes just south of the city center and near Lakewood, while a secondary cluster of elevated usage appears in south Seattle and parts of the Kent-Renton corridor. The Eastside communities of Bellevue, Kirkland, and Redmond consistently register among the lowest rates in the metro, generally below 5%, creating a stark east-west disparity across Lake Washington. Peripheral zip codes to the far northwest and southwest of the metro also show moderately high SNAP reliance in the 15–20% range, suggesting that distance from major employment centers correlates with greater food assistance need.
Data: U.S. Census Bureau, 2023 ACS
Explore
- Population Non-Hispanic American Indian % by Zip Code (ZCTA5) — Chicago Metro
- High School Graduate (% of Over 25) by Zip Code (ZCTA5) — Minneapolis Metro
- U.S. Citizens (% of Population Over 18) by Zip Code (ZCTA5) — Minneapolis Metro
- Population Non-Hispanic Asian % by Zip Code (ZCTA5) — Seattle Metro
- Population Non-Hispanic Black % by Zip Code (ZCTA5) — Minneapolis Metro
- Population Hispanic % by Zip Code (ZCTA5) — Minneapolis Metro
- Population Non-Hispanic American Indian % by Zip Code (ZCTA5) — Minneapolis Metro
- Population Non-Hispanic White % by Zip Code (ZCTA5) — Minneapolis Metro
- Median Age by Zip Code (ZCTA5) — Minneapolis Metro
- Household Median Income by Zip Code (ZCTA5) — Minneapolis Metro
- % of Population without Health Insurance, by County
- U.S. Citizens (% of Population Over 18) by Zip Code (ZCTA5) — Chicago Metro
- High School Graduate (% of Over 25) by Zip Code (ZCTA5) — Chicago Metro
- Household Median Income by Zip Code (ZCTA5) — Chicago Metro
- Median Age by Zip Code (ZCTA5) — Chicago Metro
- Population Non-Hispanic Asian % by Zip Code (ZCTA5) — Los Angeles Metro
- Population Non-Hispanic White % by Zip Code (ZCTA5) — Chicago Metro
- Population Hispanic % by Zip Code (ZCTA5) — Chicago Metro
- Population Non-Hispanic Black % by Zip Code (ZCTA5) — Chicago Metro
- Housing Owner-Occupied % of Units, by Zip Code (ZCTA5) — Boston Metro
- % of Households with Broadband Internet, by Zip Code (ZCTA5) — Boston Metro
- Housing Owner-Occupied Median Value ($), by Zip Code (ZCTA5) — Boston Metro
- Median Age by Zip Code (ZCTA5) — Boston Metro
- Population Hispanic % by Zip Code (ZCTA5) — Boston Metro
- U.S. Citizens (% of Population Over 18) by Zip Code (ZCTA5) — Boston Metro
- Population Non-Hispanic White % by Zip Code (ZCTA5) — Boston Metro
- Population Non-Hispanic American Indian % by Zip Code (ZCTA5) — Boston Metro
- Bachelor's Degree or Higher (% of Over 25) by Zip Code (ZCTA5) — Boston Metro
- % of Population without Health Insurance, by Zip Code (ZCTA5) — Boston Metro
- Housing Owner-Occupied % of Units, by Zip Code (ZCTA5) — Seattle Metro
- % of Population on Food Stamps or SNAP (Last 12 Months), by Zip Code (ZCTA5) — Tampa Metro
- % of Population on Food Stamps or SNAP (Last 12 Months), by Zip Code (ZCTA5) — Miami Metro
- % of Population on Food Stamps or SNAP (Last 12 Months), by Zip Code (ZCTA5) — Boston Metro
- % of Population on Food Stamps or SNAP (Last 12 Months), by Zip Code (ZCTA5) — St. Louis Metro
- % of Population on Food Stamps or SNAP (Last 12 Months), by Zip Code (ZCTA5) — Dallas Metro
- % of Population on Food Stamps or SNAP (Last 12 Months), by Zip Code (ZCTA5) — Detroit Metro
- % of Population on Food Stamps or SNAP (Last 12 Months), by Zip Code (ZCTA5) — Orlando Metro
- % of Population on Food Stamps or SNAP (Last 12 Months), by Zip Code (ZCTA5) — Houston Metro
- % of Population on Food Stamps or SNAP (Last 12 Months), by Zip Code (ZCTA5) — Chicago Metro
- % of Population on Food Stamps or SNAP (Last 12 Months), by Zip Code (ZCTA5) — Phoenix Metro