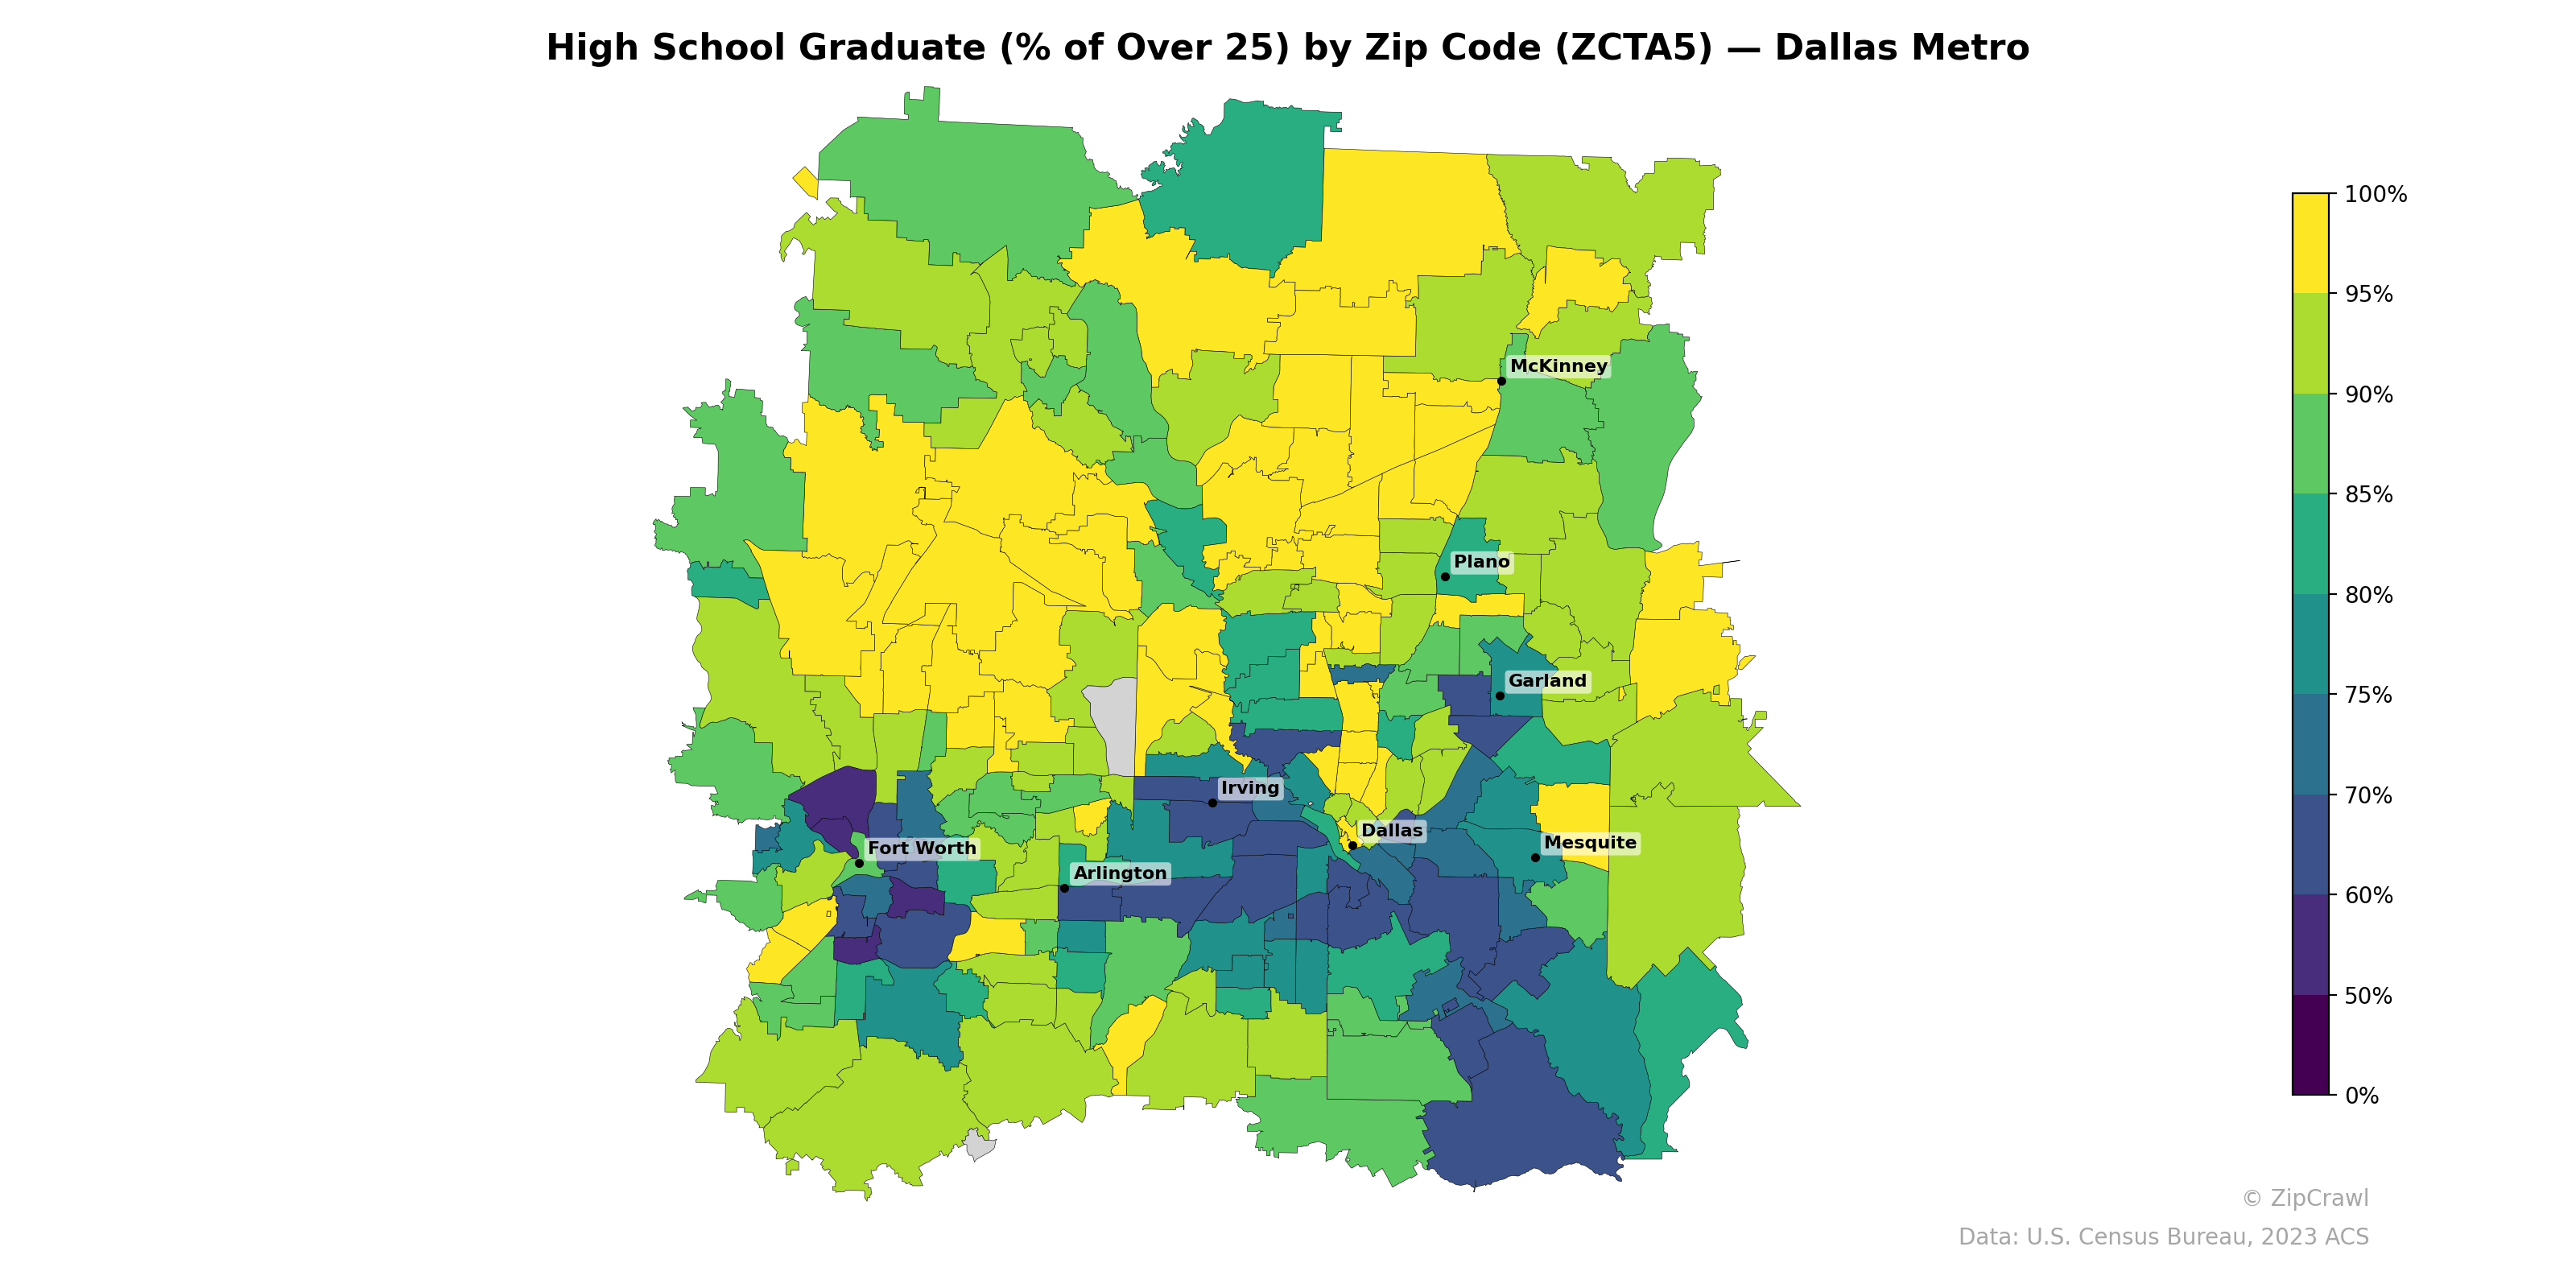
NOTE: Gray indicates insufficient data or a suppressed estimate.
High school graduation rates across the Dallas-Fort Worth metro exhibit a stark north-south divide, with zip codes north of the I-30 corridor—particularly around Plano, McKinney, and the northern suburbs—consistently reaching 90–100%, while southern Dallas, parts of south Fort Worth, and several southeast exurban areas fall below 60–70%. Central Dallas and the Irving-to-Garland corridor display notable pockets of lower attainment (50–70%), likely corresponding to immigrant-dense communities and historically underinvested neighborhoods. The western Fort Worth suburbs show more heterogeneity than their northern Dallas counterparts, with graduation rates varying sharply between adjacent zip codes in the 70–90% range.
Data: U.S. Census Bureau, 2023 ACS
Explore
- Population Non-Hispanic White % by Zip Code (ZCTA5) — New York Metro
- Population Non-Hispanic American Indian % by Zip Code (ZCTA5) — Dallas Metro
- Population Non-Hispanic Asian % by Zip Code (ZCTA5) — Georgia
- Population Non-Hispanic White % by Zip Code (ZCTA5) — Dallas Metro
- Population Non-Hispanic Black % by Zip Code (ZCTA5) — Dallas Metro
- Household Median Income by Zip Code (ZCTA5) — Dallas Metro
- Population Hispanic % by Zip Code (ZCTA5) — Dallas Metro
- % of Population on Food Stamps or SNAP (Last 12 Months), by Zip Code (ZCTA5) — Georgia
- U.S. Citizens (% of Population Over 18) by Zip Code (ZCTA5) — Dallas Metro
- Median Age by Zip Code (ZCTA5) — Dallas Metro
- Household Average Size by Zip Code (ZCTA5) — Iowa
- Median Age by County
- Bachelor's Degree or Higher (% of Over 25) by Zip Code (ZCTA5) — New York Metro
- U.S. Citizens (% of Population Over 18) by Zip Code (ZCTA5) — New York Metro
- Population Hispanic % by Zip Code (ZCTA5) — New York Metro
- % of Population on Food Stamps or SNAP (Last 12 Months), by County
- Population Non-Hispanic Black % by Zip Code (ZCTA5) — New York Metro
- Population Non-Hispanic American Indian % by Zip Code (ZCTA5) — New York Metro
- Household Median Income by Zip Code (ZCTA5) — New York Metro
- Median Age by Zip Code (ZCTA5) — New York Metro
- Housing % of Units Built Since 2010, by Zip Code (ZCTA5) — Ohio
- Housing Median Monthly Rent ($), by Zip Code (ZCTA5) — Ohio
- Household Average Size by Zip Code (ZCTA5) — Ohio
- Bachelor's Degree or Higher (% of Over 25) by Zip Code (ZCTA5) — Ohio
- Population Non-Hispanic American Indian % by Zip Code (ZCTA5) — Ohio
- % of Households with Broadband Internet, by Zip Code (ZCTA5) — Ohio
- Housing Owner-Occupied % of Units, by Zip Code (ZCTA5) — Ohio
- Housing Owner-Occupied Median Value ($), by Zip Code (ZCTA5) — Ohio
- Population Hispanic % by Zip Code (ZCTA5) — Ohio
- Population Non-Hispanic Black % by Zip Code (ZCTA5) — Ohio
- High School Graduate (% of Over 25) by Zip Code (ZCTA5) — Denver Metro
- High School Graduate (% of Over 25) by Zip Code (ZCTA5) — Detroit Metro
- High School Graduate (% of Over 25) by Zip Code (ZCTA5) — Miami Metro
- High School Graduate (% of Over 25) by Zip Code (ZCTA5) — Boston Metro
- High School Graduate (% of Over 25) by Zip Code (ZCTA5) — Tampa Metro
- High School Graduate (% of Over 25) by Zip Code (ZCTA5) — San Diego Metro
- High School Graduate (% of Over 25) by Zip Code (ZCTA5) — Houston Metro
- High School Graduate (% of Over 25) by Zip Code (ZCTA5) — Chicago Metro
- High School Graduate (% of Over 25) by Zip Code (ZCTA5) — Seattle Metro
- High School Graduate (% of Over 25) by Zip Code (ZCTA5) — Orlando Metro