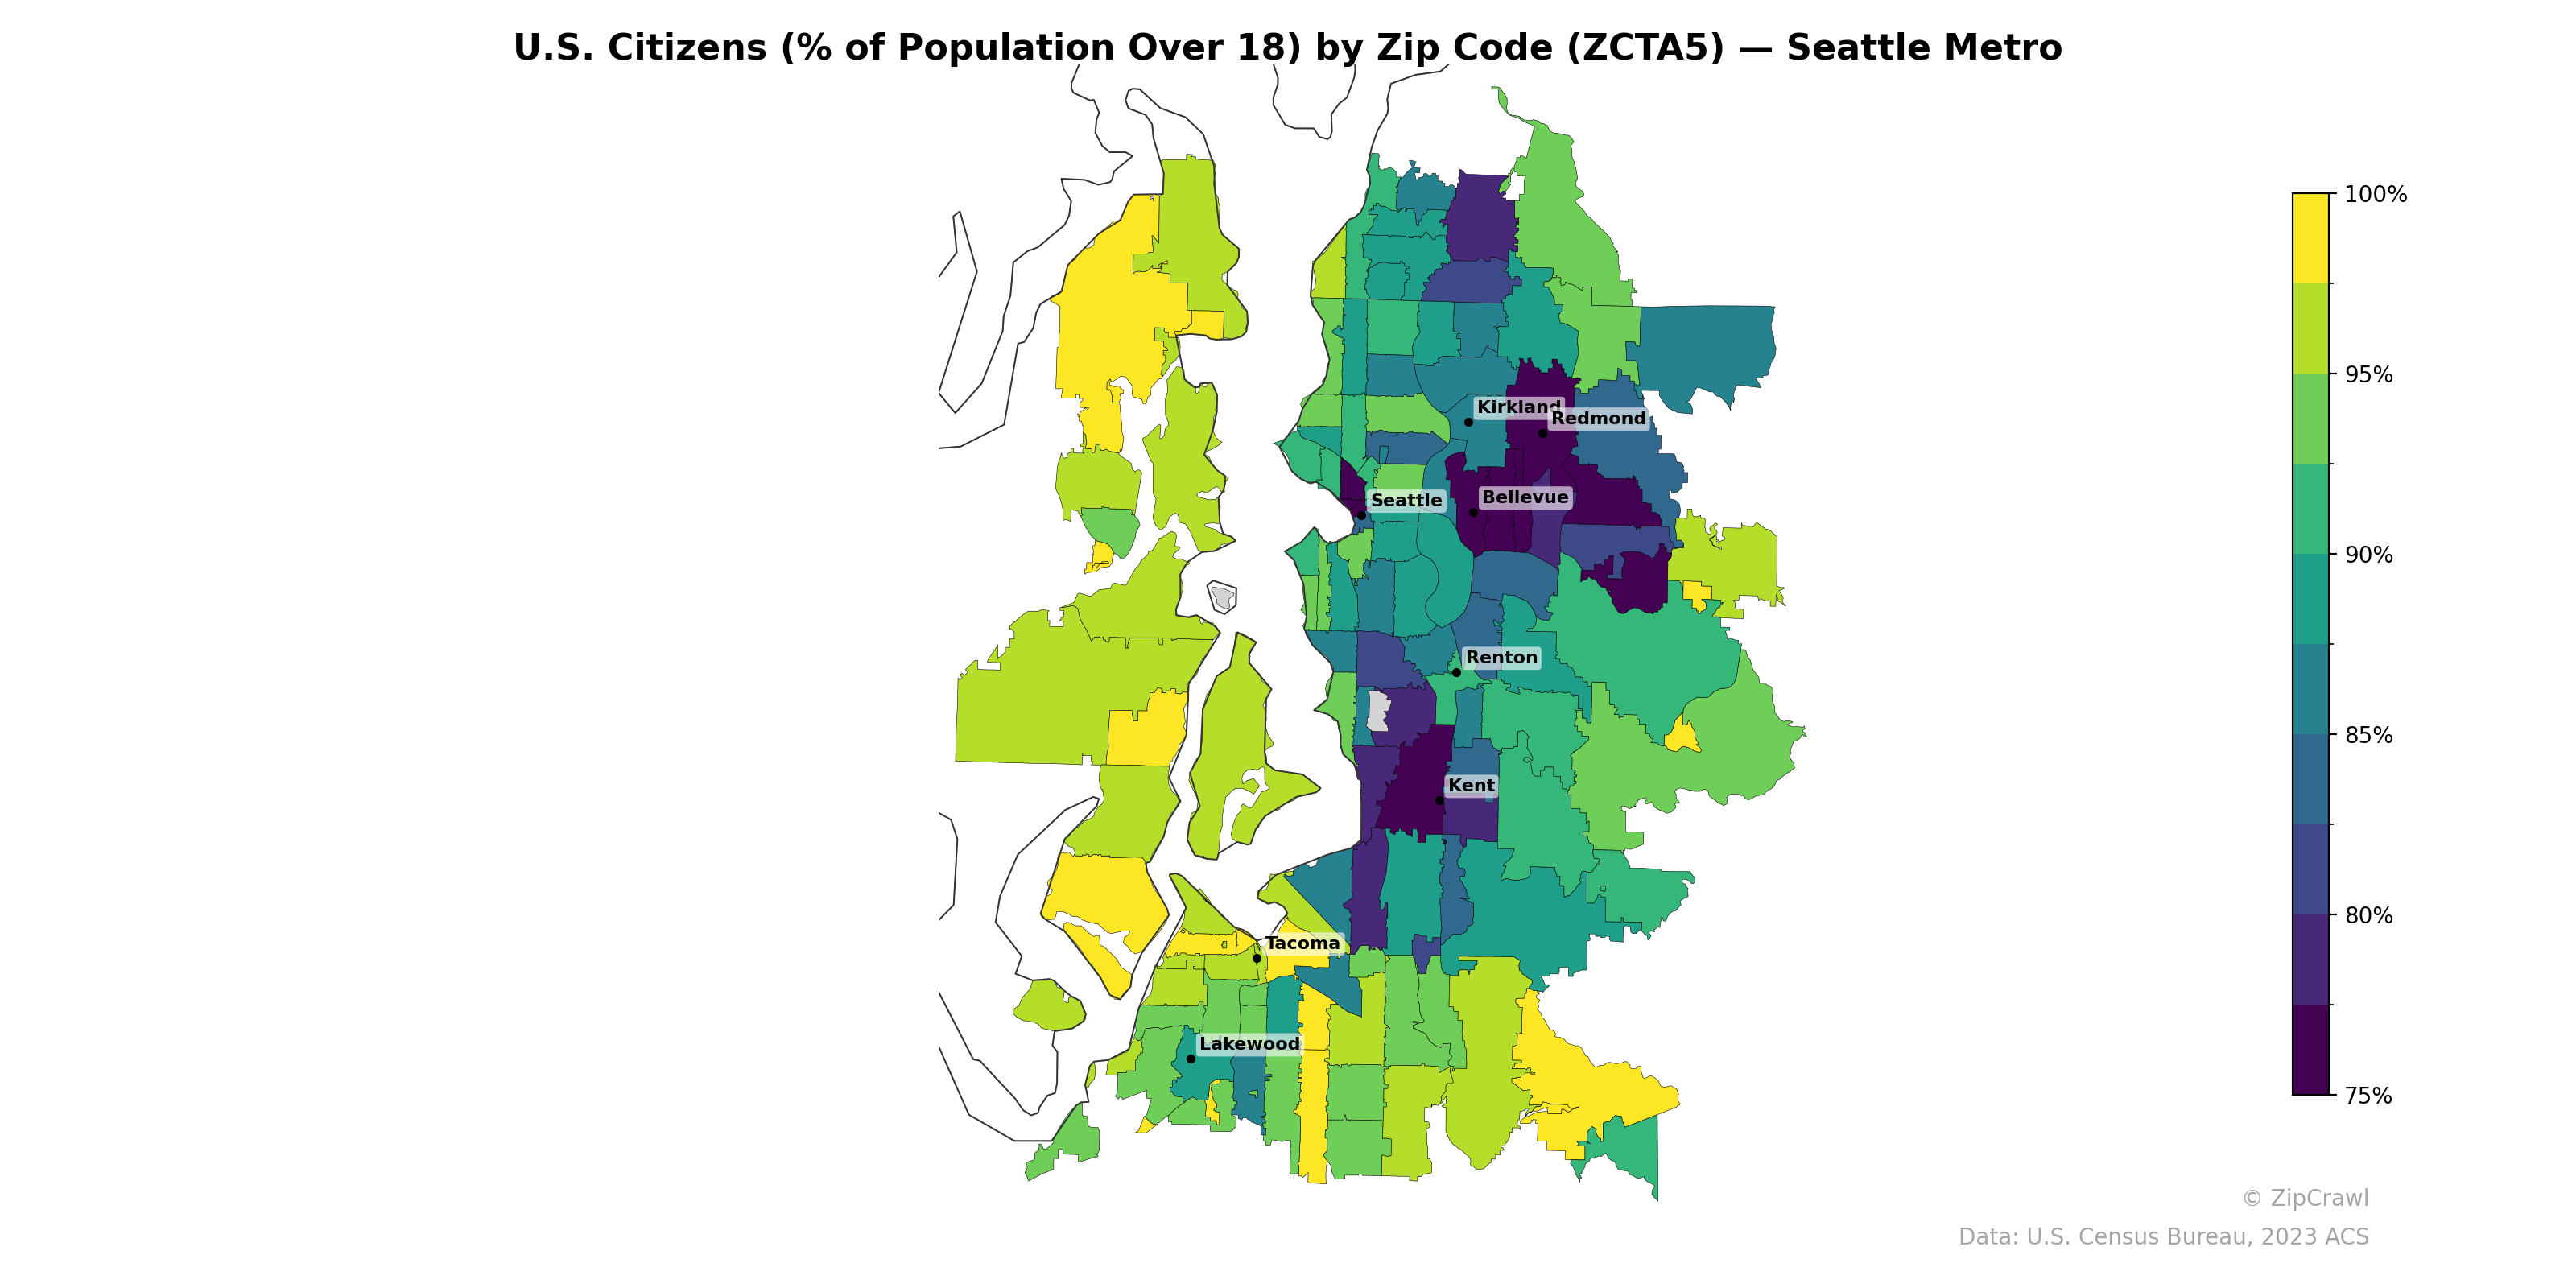
NOTE: Gray indicates insufficient data or a suppressed estimate.
The lowest U.S. citizenship rates among adults cluster prominently in the Bellevue–Redmond corridor and parts of central/south Seattle, where several zip codes fall below 80%, likely reflecting concentrations of immigrant and visa-holder populations tied to the region's tech industry. In contrast, the western and northwestern periphery of the metro area—including areas on the Kitsap Peninsula and north of Shoreline—consistently registers citizenship rates above 95%, appearing in bright yellow-green tones. A secondary pocket of lower citizenship rates emerges around Lakewood and parts of south Tacoma, suggesting a more dispersed but notable non-citizen population in the southern reaches of the metro.
Data: U.S. Census Bureau, 2023 ACS
Explore
- Population Hispanic % by Zip Code (ZCTA5) — Chicago Metro
- High School Graduate (% of Over 25) by Zip Code (ZCTA5) — Seattle Metro
- Household Median Income by Zip Code (ZCTA5) — Seattle Metro
- % of Population on Food Stamps or SNAP (Last 12 Months), by Zip Code (ZCTA5) — Detroit Metro
- Population Non-Hispanic Black % by Zip Code (ZCTA5) — Seattle Metro
- Population Hispanic % by Zip Code (ZCTA5) — Seattle Metro
- Median Age by Zip Code (ZCTA5) — Seattle Metro
- Population Non-Hispanic White % by Zip Code (ZCTA5) — Seattle Metro
- Population Non-Hispanic American Indian % by Zip Code (ZCTA5) — Seattle Metro
- Population Non-Hispanic Asian % by Zip Code (ZCTA5) — Detroit Metro
- % of Population without Health Insurance, by County
- Median Age by Zip Code (ZCTA5) — Chicago Metro
- Household Median Income by Zip Code (ZCTA5) — Chicago Metro
- Population Non-Hispanic White % by Zip Code (ZCTA5) — Chicago Metro
- Population Non-Hispanic Asian % by Zip Code (ZCTA5) — Los Angeles Metro
- % of Population on Food Stamps or SNAP (Last 12 Months), by Zip Code (ZCTA5) — Los Angeles Metro
- Population Non-Hispanic Black % by Zip Code (ZCTA5) — Chicago Metro
- Population Non-Hispanic American Indian % by Zip Code (ZCTA5) — Chicago Metro
- High School Graduate (% of Over 25) by Zip Code (ZCTA5) — Chicago Metro
- Housing Owner-Occupied Median Value ($), by Zip Code (ZCTA5) — Boston Metro
- % of Population without Health Insurance, by Zip Code (ZCTA5) — Boston Metro
- Housing Median Monthly Rent ($), by Zip Code (ZCTA5) — Boston Metro
- Population Hispanic % by Zip Code (ZCTA5) — Boston Metro
- Population Non-Hispanic Black % by Zip Code (ZCTA5) — Boston Metro
- Median Age by Zip Code (ZCTA5) — Boston Metro
- Bachelor's Degree or Higher (% of Over 25) by Zip Code (ZCTA5) — Wisconsin
- Bachelor's Degree or Higher (% of Over 25) by Zip Code (ZCTA5) — Boston Metro
- % of Households with Broadband Internet, by Zip Code (ZCTA5) — Boston Metro
- Housing Owner-Occupied % of Units, by Zip Code (ZCTA5) — Boston Metro
- Household Median Income by Zip Code (ZCTA5) — Boston Metro
- U.S. Citizens (% of Population Over 18) by Zip Code (ZCTA5) — Boston Metro
- U.S. Citizens (% of Population Over 18) by Zip Code (ZCTA5) — Denver Metro
- U.S. Citizens (% of Population Over 18) by Zip Code (ZCTA5) — Miami Metro
- U.S. Citizens (% of Population Over 18) by Zip Code (ZCTA5) — Detroit Metro
- U.S. Citizens (% of Population Over 18) by Zip Code (ZCTA5) — Tampa Metro
- U.S. Citizens (% of Population Over 18) by Zip Code (ZCTA5) — Dallas Metro
- U.S. Citizens (% of Population Over 18) by Zip Code (ZCTA5) — Houston Metro
- U.S. Citizens (% of Population Over 18) by Zip Code (ZCTA5) — Phoenix Metro
- U.S. Citizens (% of Population Over 18) by Zip Code (ZCTA5) — Chicago Metro
- U.S. Citizens (% of Population Over 18) by Zip Code (ZCTA5) — Orlando Metro