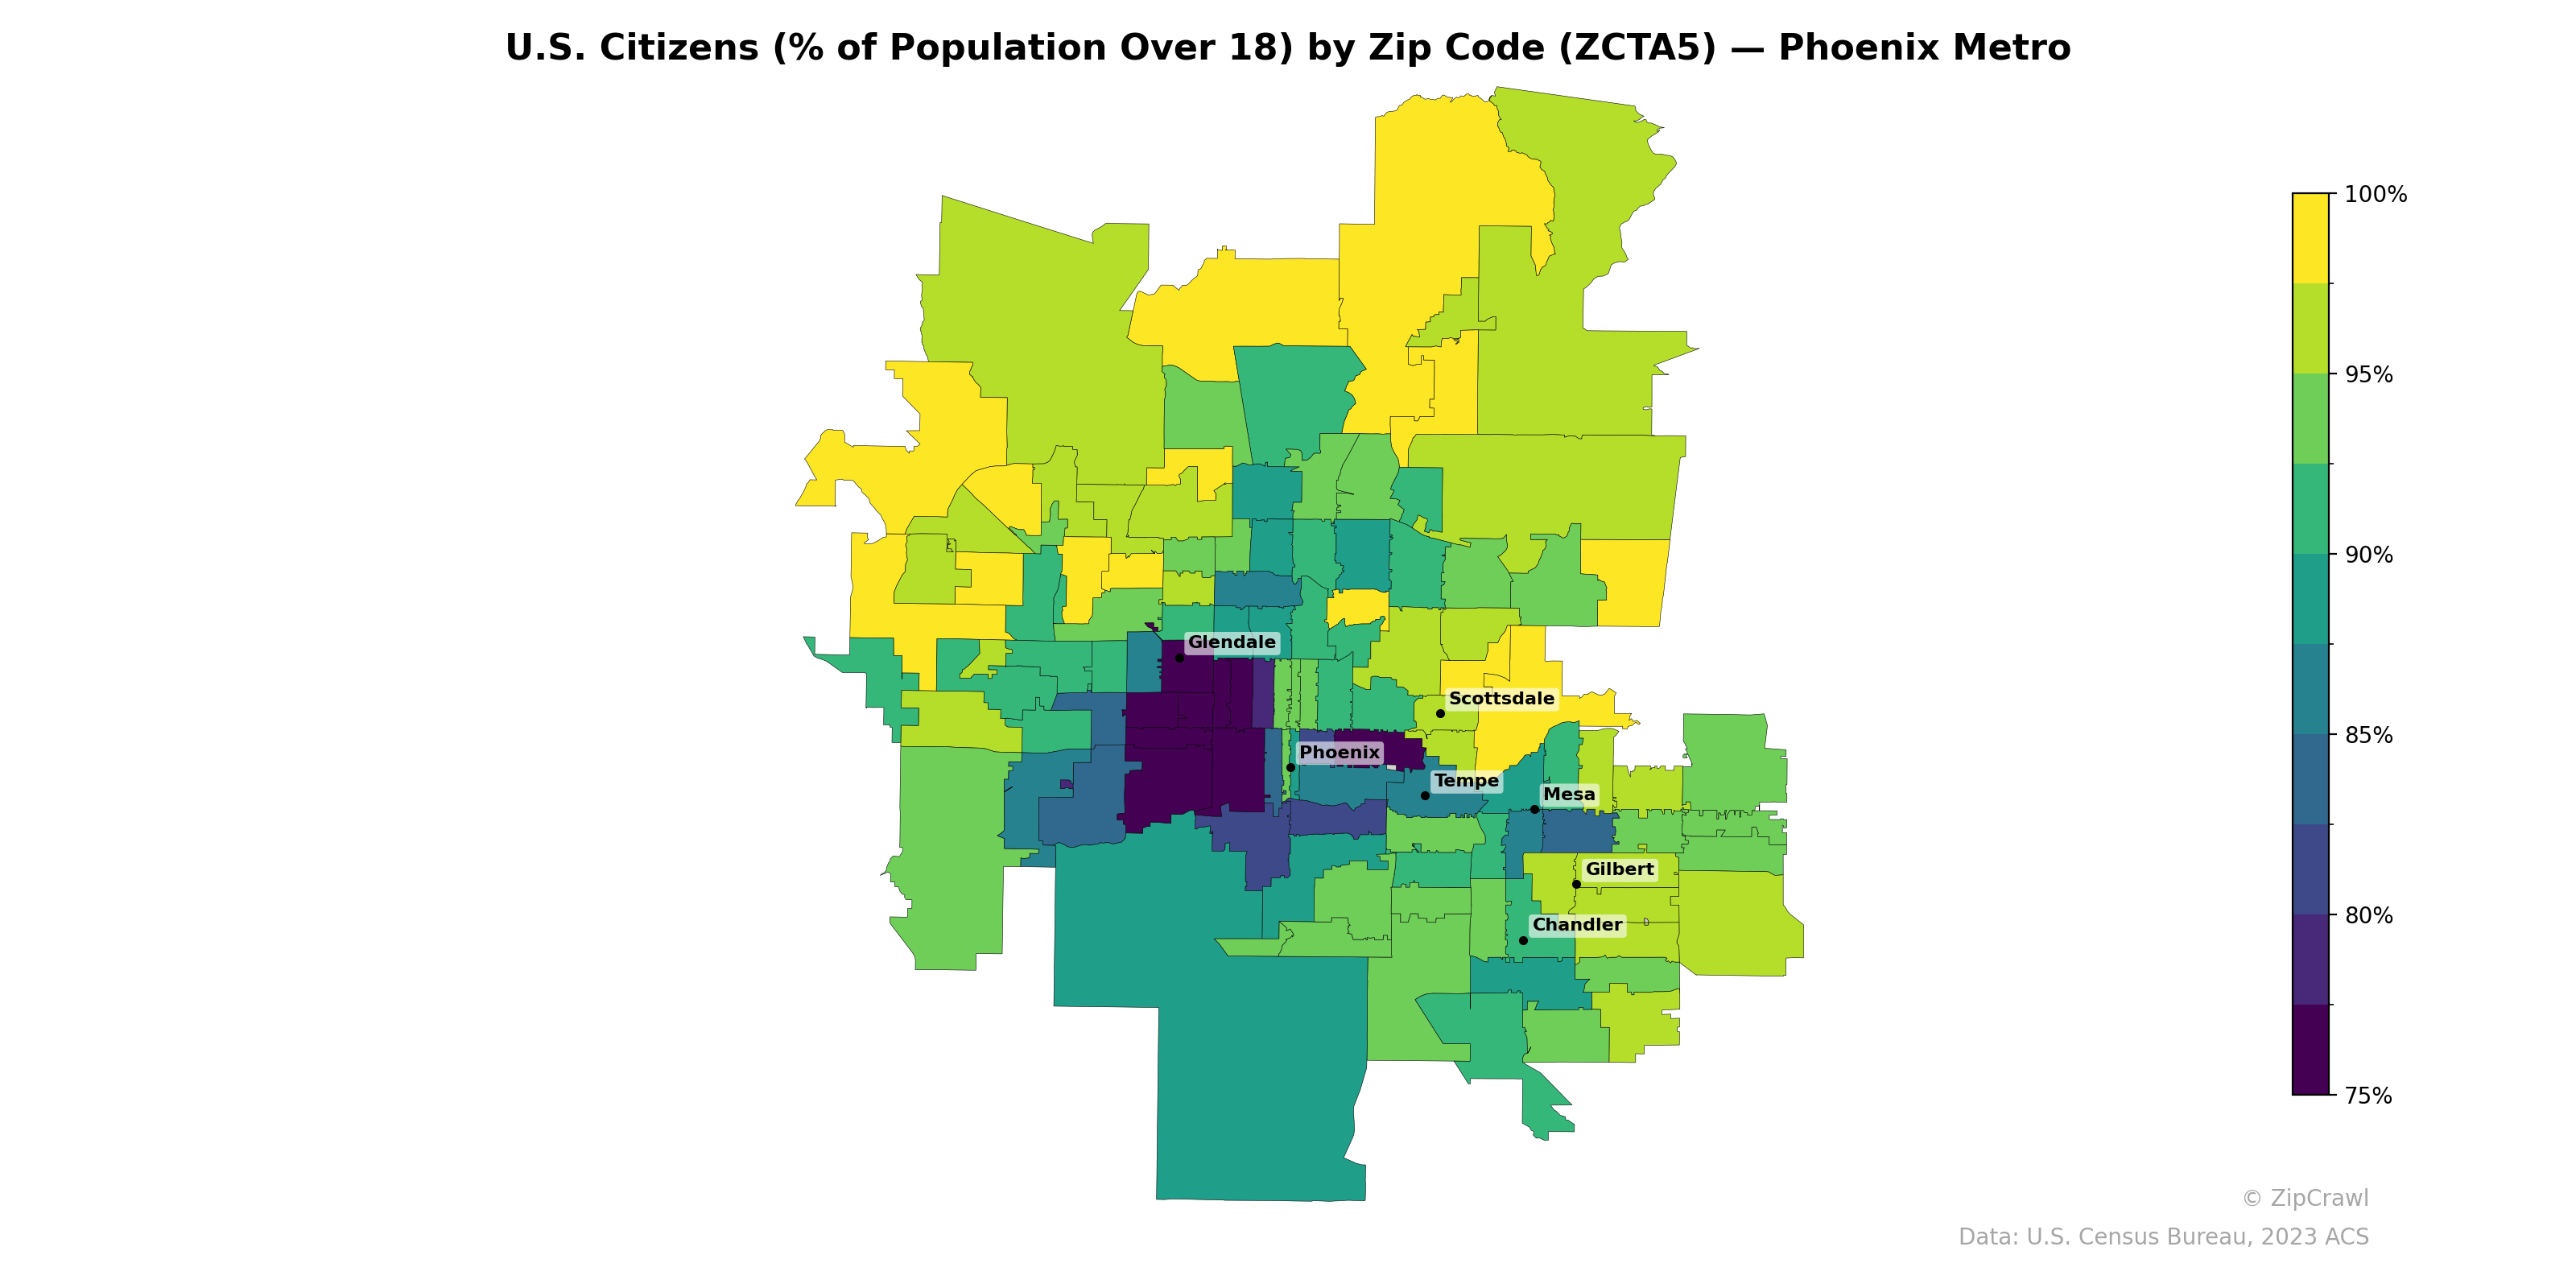
NOTE: Gray indicates insufficient data or a suppressed estimate.
Zip codes in central and south Phoenix, particularly around the Phoenix core and areas south of Glendale, exhibit the lowest U.S. citizenship rates among adults, dropping to approximately 75–80%, forming a distinct cluster of dark-shaded zones. In contrast, the northern and northeastern portions of the metro—especially the outer suburbs and areas north of Scottsdale—consistently reach 95–100% citizenship rates, as do many of the peripheral zip codes on the metro's western and southeastern edges. The Tempe and Mesa areas display moderate variability, with pockets of lower citizenship rates interspersed among higher-rate neighbors, suggesting localized demographic diversity within these mid-metro communities.
Data: U.S. Census Bureau, 2023 ACS
Explore
- Population Non-Hispanic American Indian % by Zip Code (ZCTA5) — Phoenix Metro
- Population Hispanic % by Zip Code (ZCTA5) — Phoenix Metro
- High School Graduate (% of Over 25) by Zip Code (ZCTA5) — Phoenix Metro
- Population Non-Hispanic Black % by Zip Code (ZCTA5) — Phoenix Metro
- Household Median Income by Zip Code (ZCTA5) — Phoenix Metro
- % of Population on Food Stamps or SNAP (Last 12 Months), by Zip Code (ZCTA5) — Philadelphia Metro
- Population Non-Hispanic Asian % by Zip Code (ZCTA5) — Philadelphia Metro
- Median Age by Zip Code (ZCTA5) — Phoenix Metro
- Population Non-Hispanic White % by Zip Code (ZCTA5) — Phoenix Metro
- Bachelor's Degree or Higher (% of Over 25) by Zip Code (ZCTA5) — Hawaii
- Population Hispanic % by County
- High School Graduate (% of Over 25) by Zip Code (ZCTA5) — Los Angeles Metro
- Population Non-Hispanic White % by Zip Code (ZCTA5) — Los Angeles Metro
- Population Non-Hispanic American Indian % by Zip Code (ZCTA5) — Los Angeles Metro
- % of Population on Food Stamps or SNAP (Last 12 Months), by Zip Code (ZCTA5) — New York Metro
- Median Age by Zip Code (ZCTA5) — Los Angeles Metro
- Household Median Income by Zip Code (ZCTA5) — New York Metro
- Population Non-Hispanic Black % by Zip Code (ZCTA5) — Los Angeles Metro
- Household Median Income by Zip Code (ZCTA5) — Los Angeles Metro
- Population Hispanic % by Zip Code (ZCTA5) — Los Angeles Metro
- Household Average Size by Zip Code (ZCTA5) — Virginia
- Housing Median Monthly Rent ($), by Zip Code (ZCTA5) — Virginia
- Married Couple (% of all Households) by Zip Code (ZCTA5) — Virginia
- Bachelor's Degree or Higher (% of Over 25) by Zip Code (ZCTA5) — Virginia
- High School Graduate (% of Over 25) by Zip Code (ZCTA5) — Virginia
- % of Households with Broadband Internet, by Zip Code (ZCTA5) — Virginia
- Housing Owner-Occupied % of Units, by Zip Code (ZCTA5) — Virginia
- Housing Owner-Occupied Median Value ($), by Zip Code (ZCTA5) — Virginia
- Housing % of Units Built Since 2010, by Zip Code (ZCTA5) — Virginia
- Population Non-Hispanic Black % by Zip Code (ZCTA5) — Virginia
- U.S. Citizens (% of Population Over 18) by Zip Code (ZCTA5) — Boston Metro
- U.S. Citizens (% of Population Over 18) by Zip Code (ZCTA5) — Miami Metro
- U.S. Citizens (% of Population Over 18) by Zip Code (ZCTA5) — Denver Metro
- U.S. Citizens (% of Population Over 18) by Zip Code (ZCTA5) — Detroit Metro
- U.S. Citizens (% of Population Over 18) by Zip Code (ZCTA5) — Tampa Metro
- U.S. Citizens (% of Population Over 18) by Zip Code (ZCTA5) — Dallas Metro
- U.S. Citizens (% of Population Over 18) by Zip Code (ZCTA5) — Houston Metro
- U.S. Citizens (% of Population Over 18) by Zip Code (ZCTA5) — Seattle Metro
- U.S. Citizens (% of Population Over 18) by Zip Code (ZCTA5) — Chicago Metro
- U.S. Citizens (% of Population Over 18) by Zip Code (ZCTA5) — Orlando Metro