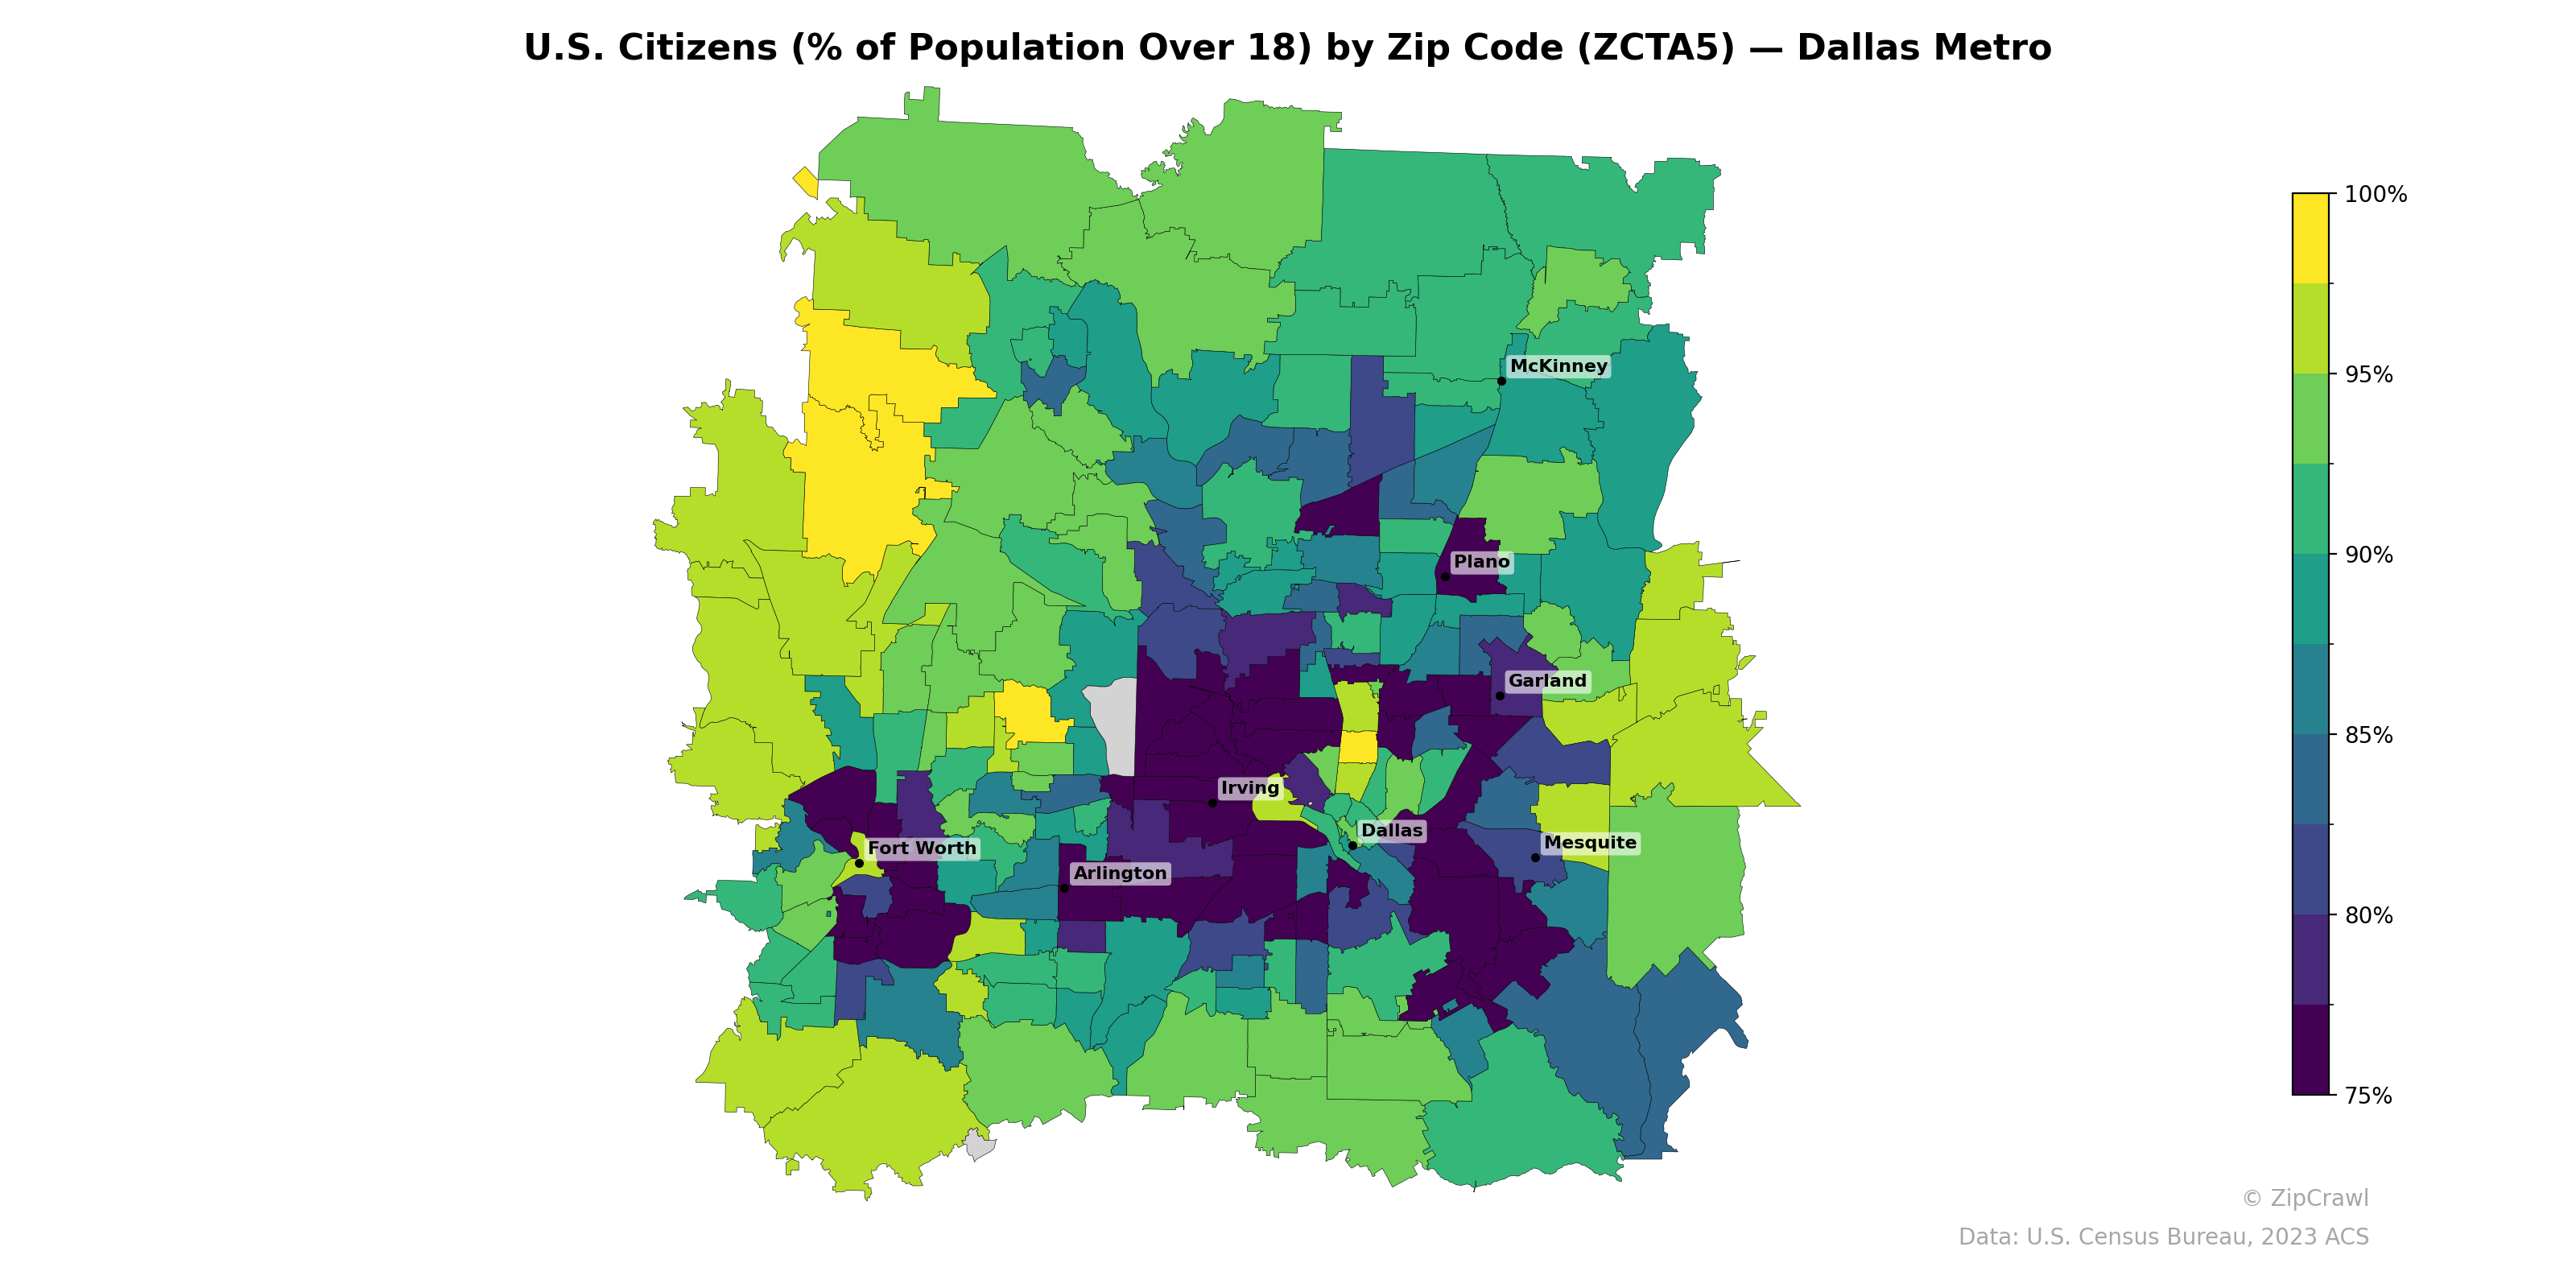
NOTE: Gray indicates insufficient data or a suppressed estimate.
Zip codes in the urban core of Dallas and immediately surrounding areas—particularly near Irving, Arlington, and parts of Fort Worth—exhibit the lowest U.S. citizenship rates among adults, frequently falling below 80%, reflecting concentrations of non-citizen immigrant populations. In stark contrast, the northern suburbs including McKinney, Plano, and the far northeastern and northwestern peripheral zip codes consistently register citizenship rates above 95%, forming a clear gradient from lower rates in the central metro to higher rates at the suburban fringe. The southeastern edge of the metro also shows pockets of lower citizenship rates, though less uniformly than the central Dallas cluster.
Data: U.S. Census Bureau, 2023 ACS
Explore
- Population Non-Hispanic White % by Zip Code (ZCTA5) — New York Metro
- High School Graduate (% of Over 25) by Zip Code (ZCTA5) — Dallas Metro
- Population Hispanic % by Zip Code (ZCTA5) — Dallas Metro
- Population Non-Hispanic White % by Zip Code (ZCTA5) — Dallas Metro
- Population Non-Hispanic American Indian % by Zip Code (ZCTA5) — Dallas Metro
- Household Median Income by Zip Code (ZCTA5) — Dallas Metro
- Population Non-Hispanic Black % by Zip Code (ZCTA5) — Dallas Metro
- Population Non-Hispanic Asian % by Zip Code (ZCTA5) — Georgia
- % of Population on Food Stamps or SNAP (Last 12 Months), by Zip Code (ZCTA5) — Georgia
- Median Age by Zip Code (ZCTA5) — Dallas Metro
- Bachelor's Degree or Higher (% of Over 25) by Zip Code (ZCTA5) — Iowa
- Median Age by County
- Bachelor's Degree or Higher (% of Over 25) by Zip Code (ZCTA5) — New York Metro
- Population Hispanic % by Zip Code (ZCTA5) — New York Metro
- Population Non-Hispanic Black % by Zip Code (ZCTA5) — New York Metro
- Population Non-Hispanic American Indian % by Zip Code (ZCTA5) — New York Metro
- Household Median Income by Zip Code (ZCTA5) — New York Metro
- % of Population on Food Stamps or SNAP (Last 12 Months), by County
- Median Age by Zip Code (ZCTA5) — New York Metro
- High School Graduate (% of Over 25) by Zip Code (ZCTA5) — New York Metro
- Housing Median Monthly Rent ($), by Zip Code (ZCTA5) — Ohio
- Housing Owner-Occupied % of Units, by Zip Code (ZCTA5) — Ohio
- Housing % of Units Built Since 2010, by Zip Code (ZCTA5) — Ohio
- High School Graduate (% of Over 25) by Zip Code (ZCTA5) — Ohio
- Population Non-Hispanic American Indian % by Zip Code (ZCTA5) — Ohio
- Bachelor's Degree or Higher (% of Over 25) by Zip Code (ZCTA5) — Ohio
- % of Population without Health Insurance, by Zip Code (ZCTA5) — Ohio
- Population Hispanic % by Zip Code (ZCTA5) — Ohio
- Housing Owner-Occupied Median Value ($), by Zip Code (ZCTA5) — Ohio
- Population Non-Hispanic White % by Zip Code (ZCTA5) — Ohio
- U.S. Citizens (% of Population Over 18) by Zip Code (ZCTA5) — Denver Metro
- U.S. Citizens (% of Population Over 18) by Zip Code (ZCTA5) — Detroit Metro
- U.S. Citizens (% of Population Over 18) by Zip Code (ZCTA5) — Miami Metro
- U.S. Citizens (% of Population Over 18) by Zip Code (ZCTA5) — Boston Metro
- U.S. Citizens (% of Population Over 18) by Zip Code (ZCTA5) — Tampa Metro
- U.S. Citizens (% of Population Over 18) by Zip Code (ZCTA5) — San Diego Metro
- U.S. Citizens (% of Population Over 18) by Zip Code (ZCTA5) — Houston Metro
- U.S. Citizens (% of Population Over 18) by Zip Code (ZCTA5) — Phoenix Metro
- U.S. Citizens (% of Population Over 18) by Zip Code (ZCTA5) — Seattle Metro
- U.S. Citizens (% of Population Over 18) by Zip Code (ZCTA5) — Chicago Metro