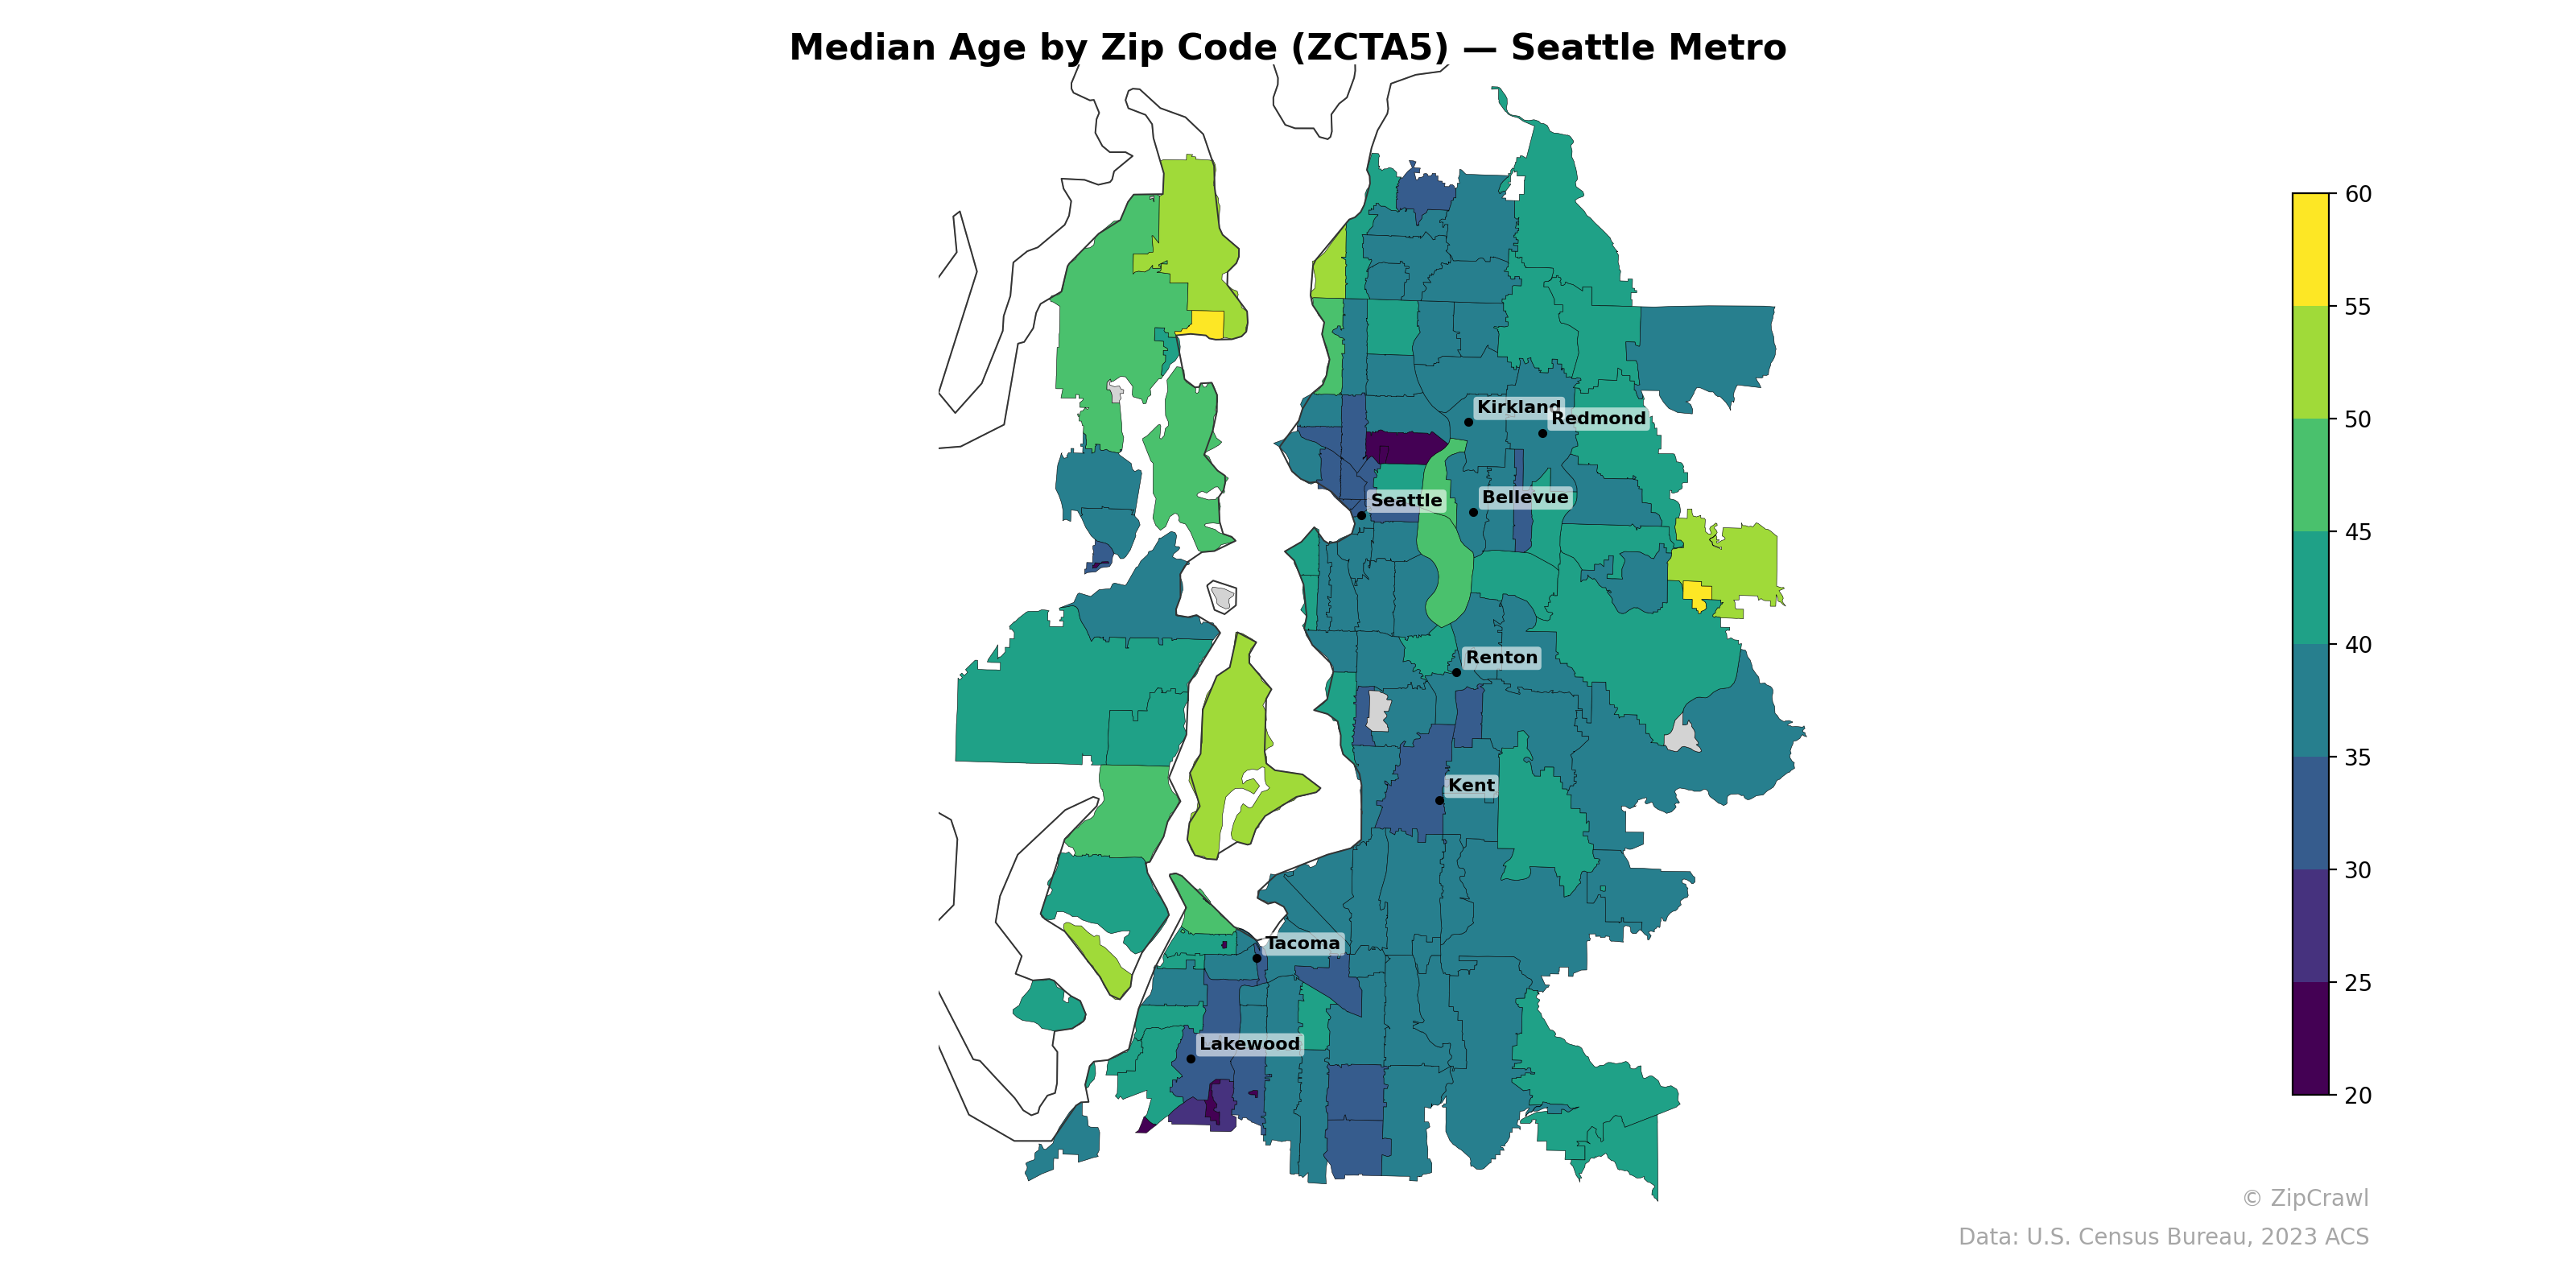
NOTE: Gray indicates insufficient data or a suppressed estimate.
Younger median ages cluster along the central Seattle corridor and near university areas, with several zip codes in the University District and downtown falling below 30, while the southern suburbs around Tacoma and Lakewood also skew younger. The oldest populations concentrate in the northern and eastern periphery of the metro, particularly in rural and exurban zip codes north of Kirkland and east of Bellevue, where median ages exceed 50. A notable east-side outlier near the Sammamish Plateau registers among the highest median ages in the metro, contrasting sharply with the younger adjacent communities in Bellevue and Redmond.
Data: U.S. Census Bureau, 2023 ACS
Explore
- Population Hispanic % by Zip Code (ZCTA5) — Chicago Metro
- High School Graduate (% of Over 25) by Zip Code (ZCTA5) — Seattle Metro
- Household Median Income by Zip Code (ZCTA5) — Seattle Metro
- Population Non-Hispanic Asian % by Zip Code (ZCTA5) — Detroit Metro
- Population Non-Hispanic Black % by Zip Code (ZCTA5) — Seattle Metro
- Population Hispanic % by Zip Code (ZCTA5) — Seattle Metro
- % of Population on Food Stamps or SNAP (Last 12 Months), by Zip Code (ZCTA5) — Detroit Metro
- Population Non-Hispanic White % by Zip Code (ZCTA5) — Seattle Metro
- U.S. Citizens (% of Population Over 18) by Zip Code (ZCTA5) — Seattle Metro
- Population Non-Hispanic American Indian % by Zip Code (ZCTA5) — Seattle Metro
- % of Population without Health Insurance, by County
- % of Population on Food Stamps or SNAP (Last 12 Months), by Zip Code (ZCTA5) — Los Angeles Metro
- High School Graduate (% of Over 25) by Zip Code (ZCTA5) — Chicago Metro
- U.S. Citizens (% of Population Over 18) by Zip Code (ZCTA5) — Chicago Metro
- Household Median Income by Zip Code (ZCTA5) — Chicago Metro
- Population Non-Hispanic Asian % by Zip Code (ZCTA5) — Los Angeles Metro
- Population Non-Hispanic White % by Zip Code (ZCTA5) — Chicago Metro
- Population Non-Hispanic Black % by Zip Code (ZCTA5) — Chicago Metro
- Population Non-Hispanic American Indian % by Zip Code (ZCTA5) — Chicago Metro
- Housing Owner-Occupied Median Value ($), by Zip Code (ZCTA5) — Boston Metro
- % of Population without Health Insurance, by Zip Code (ZCTA5) — Boston Metro
- Housing Median Monthly Rent ($), by Zip Code (ZCTA5) — Boston Metro
- Population Non-Hispanic White % by Zip Code (ZCTA5) — Boston Metro
- Population Non-Hispanic Black % by Zip Code (ZCTA5) — Boston Metro
- U.S. Citizens (% of Population Over 18) by Zip Code (ZCTA5) — Boston Metro
- Population Hispanic % by Zip Code (ZCTA5) — Boston Metro
- Bachelor's Degree or Higher (% of Over 25) by Zip Code (ZCTA5) — Boston Metro
- % of Households with Broadband Internet, by Zip Code (ZCTA5) — Boston Metro
- Housing Owner-Occupied % of Units, by Zip Code (ZCTA5) — Boston Metro
- Housing Owner-Occupied % of Units, by Zip Code (ZCTA5) — Seattle Metro
- Median Age by Zip Code (ZCTA5) — Miami Metro
- Median Age by Zip Code (ZCTA5) — Detroit Metro
- Median Age by Zip Code (ZCTA5) — Austin Metro
- Median Age by Zip Code (ZCTA5) — Boston Metro
- Median Age by Zip Code (ZCTA5) — Tampa Metro
- Median Age by Zip Code (ZCTA5) — St. Louis Metro
- Median Age by Zip Code (ZCTA5) — San Diego Metro
- Median Age by Zip Code (ZCTA5) — Atlanta Metro
- Median Age by Zip Code (ZCTA5) — Denver Metro
- Median Age by Zip Code (ZCTA5) — Chicago Metro