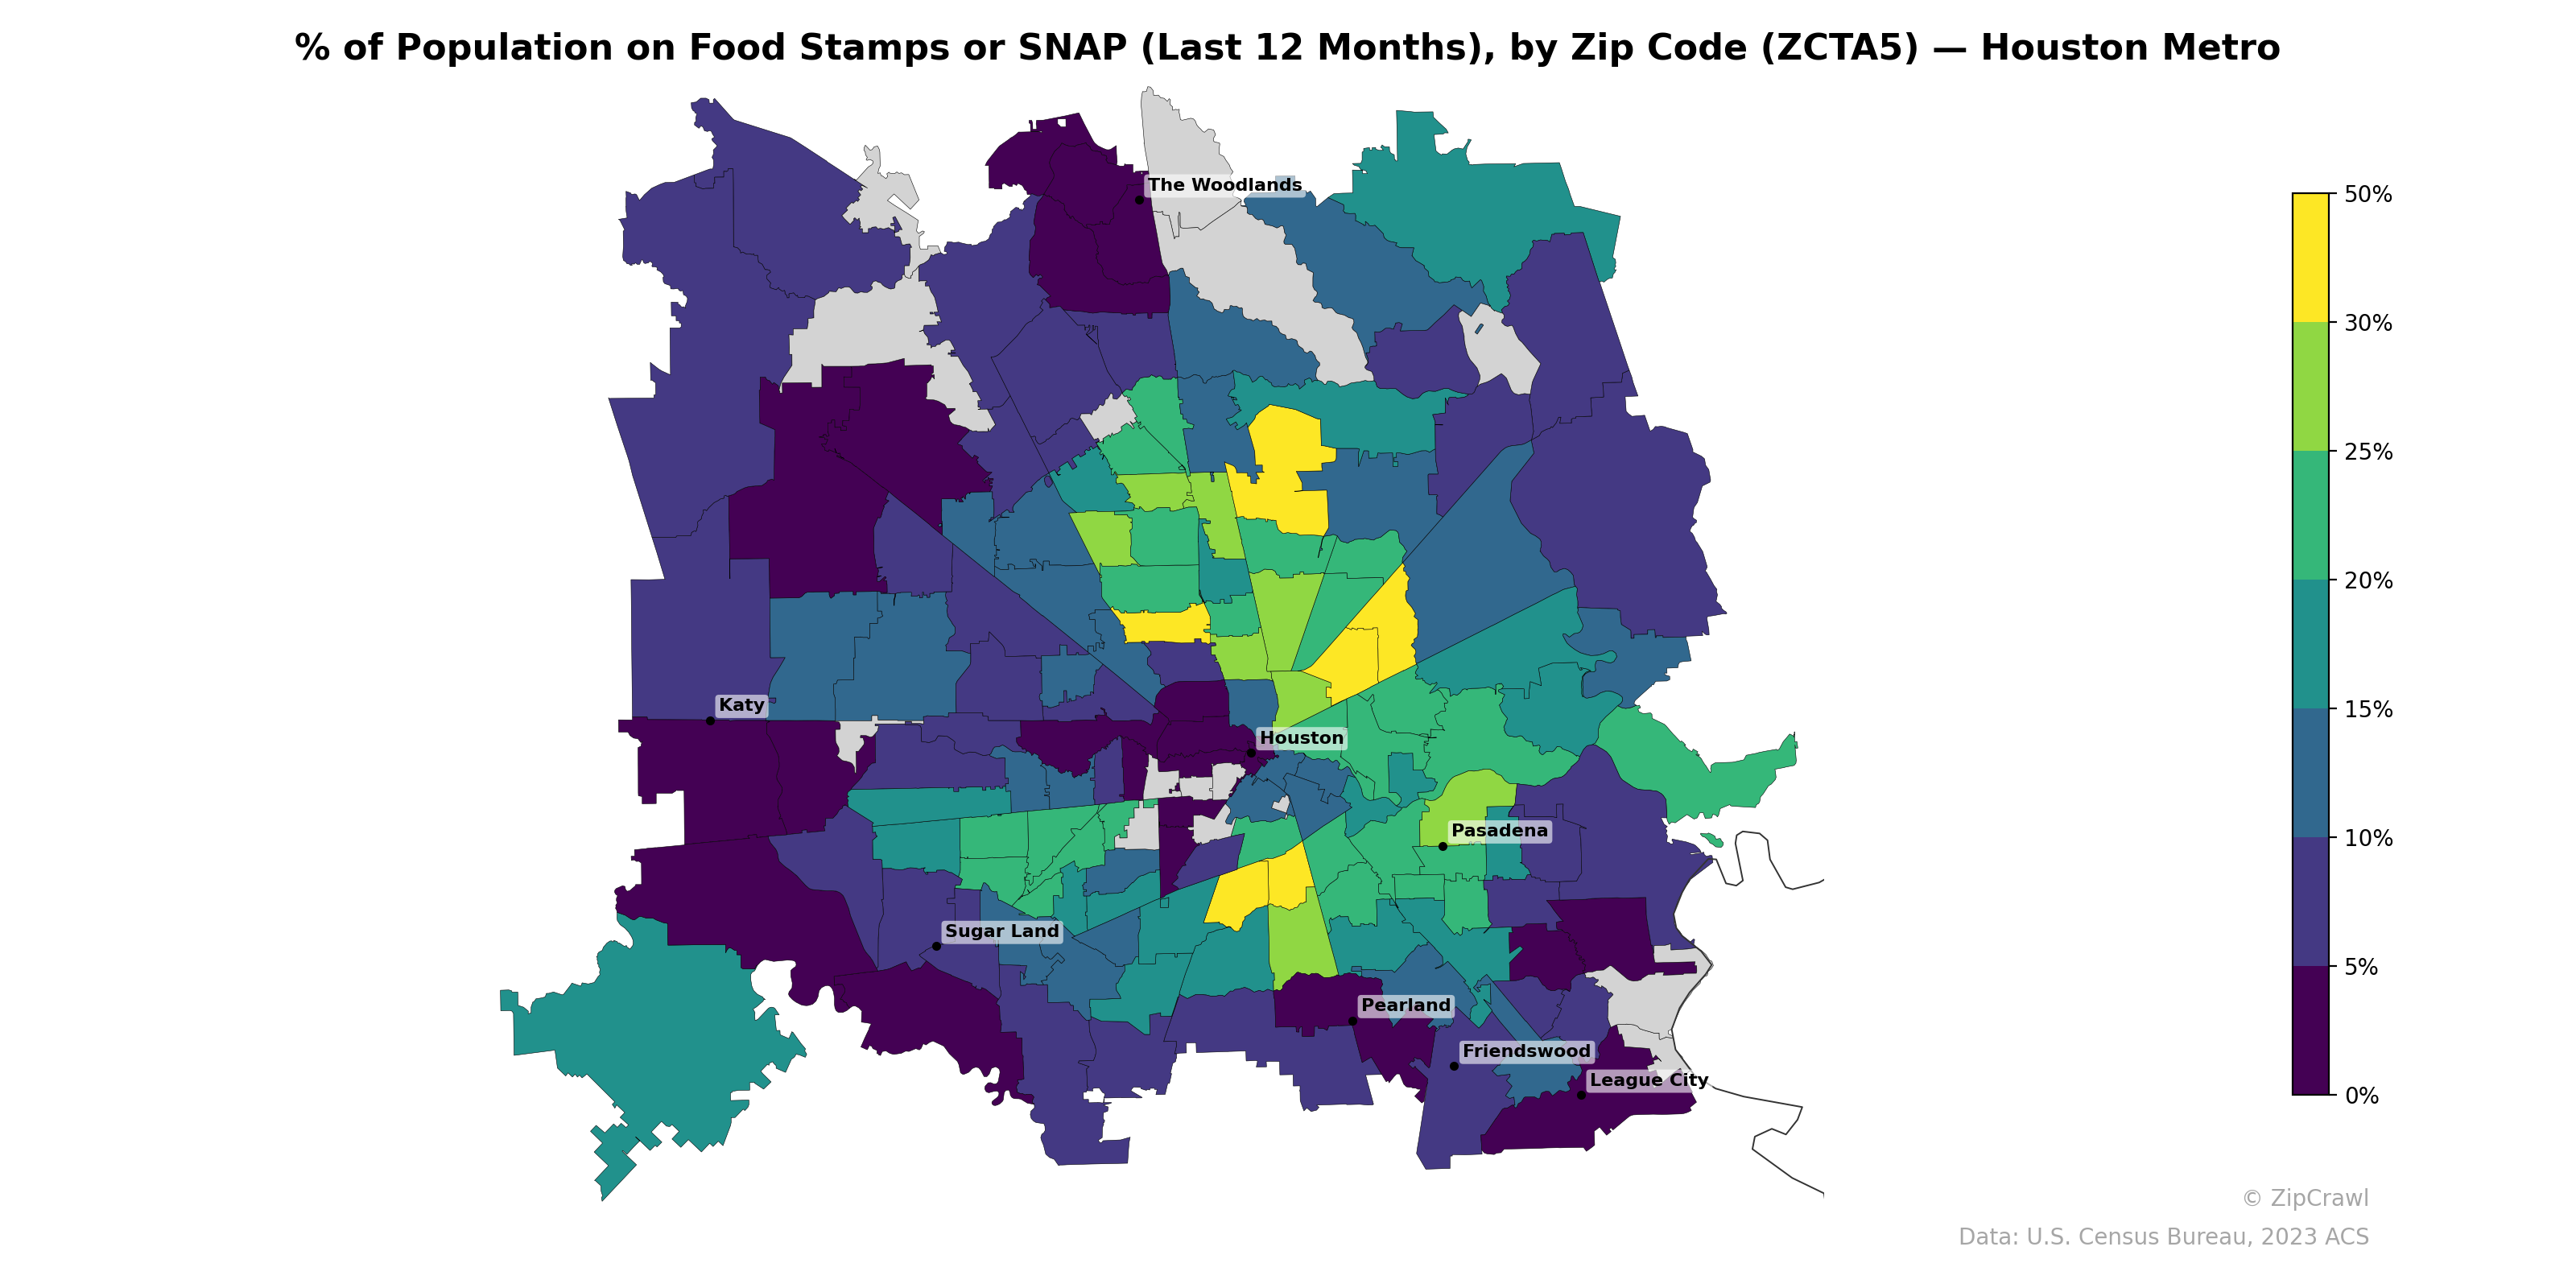
NOTE: Gray indicates insufficient data or a suppressed estimate.
The highest concentrations of SNAP participation—exceeding 30-50%—cluster tightly in zip codes within and immediately south of central Houston, particularly in the Third Ward, Sunnyside, and Greater Fifth Ward areas, forming a distinct corridor of food assistance reliance. Suburban and exurban areas such as Katy, Sugar Land, The Woodlands, Friendswood, and League City consistently register below 5-10%, creating a sharp core-periphery gradient radiating outward from the urban center. Notable pockets of elevated SNAP usage also appear in portions of northeast Houston near the Aldine area and in select zip codes south of Pasadena, contrasting with adjacent lower-rate neighborhoods.
Data: U.S. Census Bureau, 2023 ACS
Explore
- High School Graduate (% of Over 25) by Zip Code (ZCTA5) — New York Metro
- High School Graduate (% of Over 25) by Zip Code (ZCTA5) — Miami Metro
- Population Non-Hispanic Asian % by Zip Code (ZCTA5) — Houston Metro
- Population Hispanic % by Zip Code (ZCTA5) — Miami Metro
- Population Non-Hispanic Black % by Zip Code (ZCTA5) — Miami Metro
- Household Median Income by Zip Code (ZCTA5) — Miami Metro
- Population Non-Hispanic American Indian % by Zip Code (ZCTA5) — Miami Metro
- U.S. Citizens (% of Population Over 18) by Zip Code (ZCTA5) — Miami Metro
- Population Non-Hispanic White % by Zip Code (ZCTA5) — Miami Metro
- Median Age by Zip Code (ZCTA5) — Miami Metro
- High School Graduate (% of Over 25) by Zip Code (ZCTA5) — Arkansas
- Median Age by County
- U.S. Citizens (% of Population Over 18) by Zip Code (ZCTA5) — New York Metro
- Population Hispanic % by Zip Code (ZCTA5) — New York Metro
- Population Non-Hispanic White % by Zip Code (ZCTA5) — New York Metro
- Population Non-Hispanic Black % by Zip Code (ZCTA5) — New York Metro
- Median Age by Zip Code (ZCTA5) — New York Metro
- Population Non-Hispanic American Indian % by Zip Code (ZCTA5) — New York Metro
- Bachelor's Degree or Higher (% of Over 25) by Zip Code (ZCTA5) — New York Metro
- Household Median Income by Zip Code (ZCTA5) — New York Metro
- Housing Owner-Occupied Median Value ($), by Zip Code (ZCTA5) — Ohio
- % of Population without Health Insurance, by Zip Code (ZCTA5) — Ohio
- Housing Median Monthly Rent ($), by Zip Code (ZCTA5) — Ohio
- Population Non-Hispanic Black % by Zip Code (ZCTA5) — Ohio
- Population Hispanic % by Zip Code (ZCTA5) — Ohio
- Population Non-Hispanic American Indian % by Zip Code (ZCTA5) — Ohio
- Bachelor's Degree or Higher (% of Over 25) by Zip Code (ZCTA5) — Ohio
- % of Households with Broadband Internet, by Zip Code (ZCTA5) — Ohio
- Housing Owner-Occupied % of Units, by Zip Code (ZCTA5) — Ohio
- Median Age by Zip Code (ZCTA5) — Ohio
- % of Population on Food Stamps or SNAP (Last 12 Months), by Zip Code (ZCTA5) — Boston Metro
- % of Population on Food Stamps or SNAP (Last 12 Months), by Zip Code (ZCTA5) — Tampa Metro
- % of Population on Food Stamps or SNAP (Last 12 Months), by Zip Code (ZCTA5) — Austin Metro
- % of Population on Food Stamps or SNAP (Last 12 Months), by Zip Code (ZCTA5) — Miami Metro
- % of Population on Food Stamps or SNAP (Last 12 Months), by Zip Code (ZCTA5) — St. Louis Metro
- % of Population on Food Stamps or SNAP (Last 12 Months), by Zip Code (ZCTA5) — Detroit Metro
- % of Population on Food Stamps or SNAP (Last 12 Months), by Zip Code (ZCTA5) — Dallas Metro
- % of Population on Food Stamps or SNAP (Last 12 Months), by Zip Code (ZCTA5) — Orlando Metro
- % of Population on Food Stamps or SNAP (Last 12 Months), by Zip Code (ZCTA5) — Chicago Metro
- % of Population on Food Stamps or SNAP (Last 12 Months), by Zip Code (ZCTA5) — Phoenix Metro