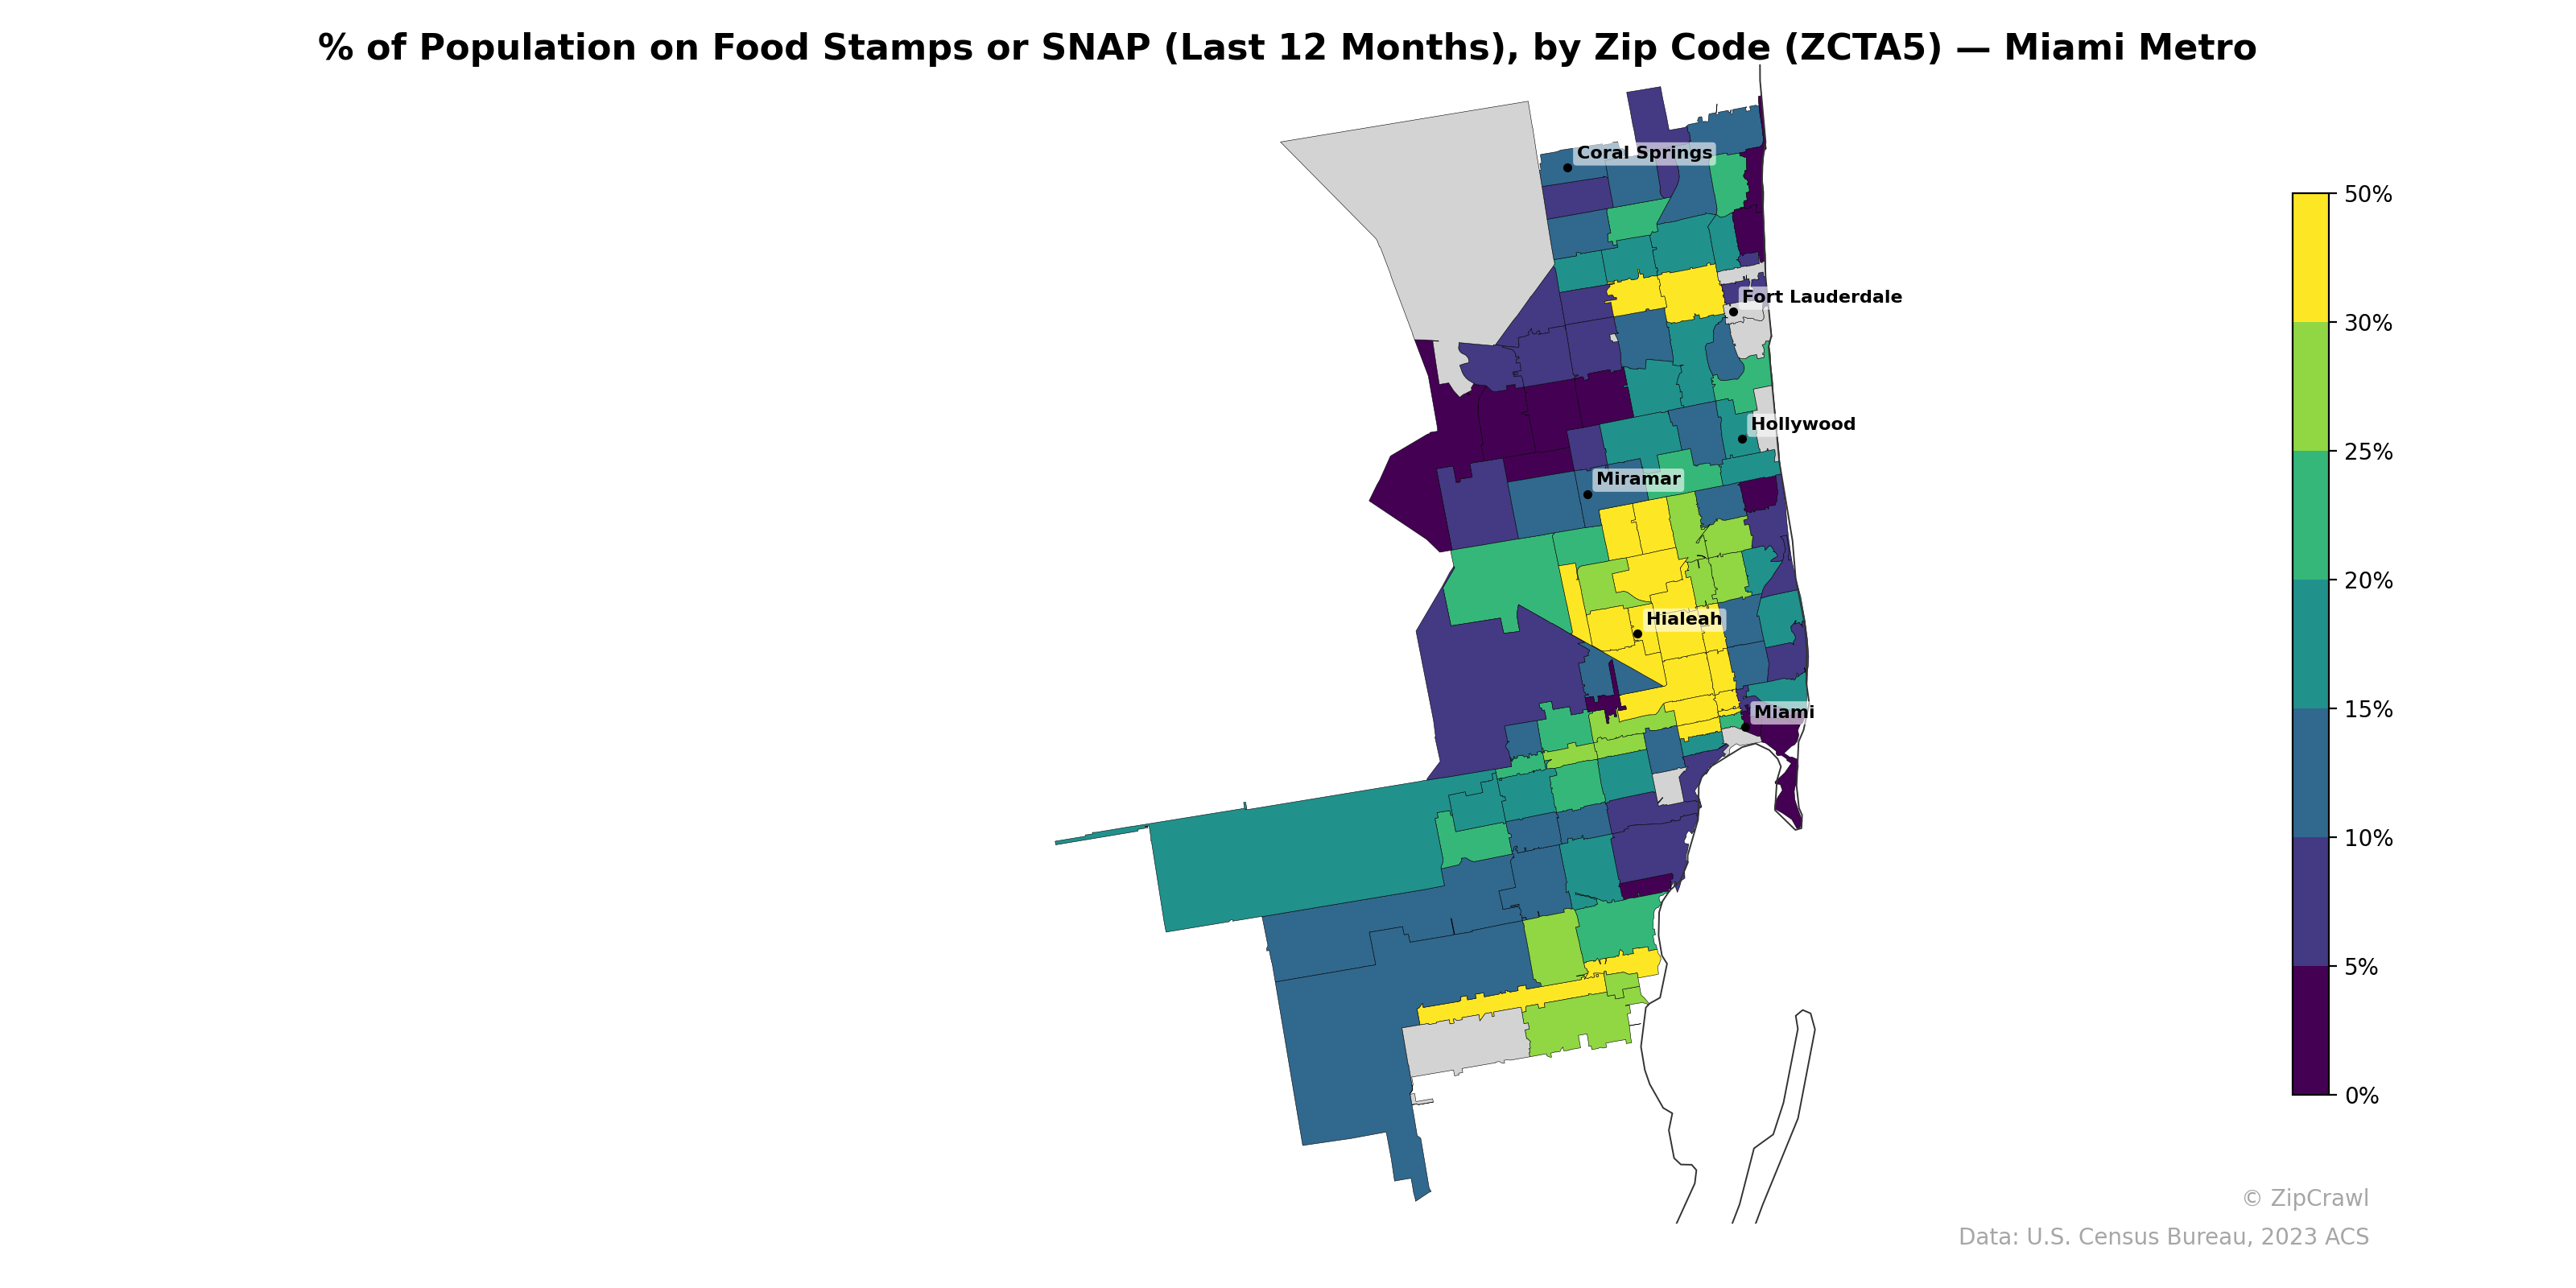
NOTE: Gray indicates insufficient data or a suppressed estimate.
The highest SNAP participation rates, exceeding 30–50%, cluster prominently in zip codes around Hialeah, parts of northern Miami, and select areas near Fort Lauderdale, forming a corridor of elevated food assistance usage through the urban core. In stark contrast, coastal zip codes along Miami Beach and the barrier islands, as well as western suburban areas extending toward the Everglades, consistently register among the lowest rates at under 5–10%. Coral Springs and the southwestern suburbs of Broward County occupy a middle range, while pockets of very high usage appear interspersed with low-usage zones in the Fort Lauderdale area, suggesting sharp socioeconomic variation at a hyperlocal level.
Data: U.S. Census Bureau, 2023 ACS
Explore
- % of Households with Broadband Internet, by Zip Code (ZCTA5) — New York Metro
- High School Graduate (% of Over 25) by Zip Code (ZCTA5) — North Carolina
- Population Non-Hispanic Asian % by Zip Code (ZCTA5) — Miami Metro
- Population Non-Hispanic American Indian % by Zip Code (ZCTA5) — North Carolina
- U.S. Citizens (% of Population Over 18) by Zip Code (ZCTA5) — North Carolina
- Household Median Income by Zip Code (ZCTA5) — North Carolina
- Population Hispanic % by Zip Code (ZCTA5) — North Carolina
- Population Non-Hispanic White % by Zip Code (ZCTA5) — North Carolina
- Population Non-Hispanic Black % by Zip Code (ZCTA5) — North Carolina
- Median Age by Zip Code (ZCTA5) — North Carolina
- High School Graduate (% of Over 25) by Zip Code (ZCTA5) — Mississippi
- Population Non-Hispanic White % by County
- Married Couple (% of all Households) by Zip Code (ZCTA5) — New York Metro
- % of Population without Health Insurance, by Zip Code (ZCTA5) — New York Metro
- Housing Vacancy Rate by Zip Code (ZCTA5) — New York Metro
- Household Average Size by Zip Code (ZCTA5) — New York Metro
- Housing Owner-Occupied Median Value ($), by Zip Code (ZCTA5) — New York Metro
- Housing Median Monthly Rent ($), by Zip Code (ZCTA5) — New York Metro
- Housing % of Units Built Since 2010, by Zip Code (ZCTA5) — New York Metro
- Population Non-Hispanic Asian % by Zip Code (ZCTA5) — New York Metro
- Household Average Size by Zip Code (ZCTA5) — North Carolina
- Housing Median Monthly Rent ($), by Zip Code (ZCTA5) — North Carolina
- Married Couple (% of all Households) by Zip Code (ZCTA5) — North Carolina
- Bachelor's Degree or Higher (% of Over 25) by Zip Code (ZCTA5) — North Carolina
- % of Households with Broadband Internet, by Zip Code (ZCTA5) — North Carolina
- % of Population without Health Insurance, by Zip Code (ZCTA5) — North Carolina
- Housing Owner-Occupied % of Units, by Zip Code (ZCTA5) — North Carolina
- Housing Owner-Occupied Median Value ($), by Zip Code (ZCTA5) — North Carolina
- Housing % of Units Built Since 2010, by Zip Code (ZCTA5) — North Carolina
- Housing Vacancy Rate by Zip Code (ZCTA5) — North Carolina
- % of Population on Food Stamps or SNAP (Last 12 Months), by Zip Code (ZCTA5) — Tampa Metro
- % of Population on Food Stamps or SNAP (Last 12 Months), by Zip Code (ZCTA5) — St. Louis Metro
- % of Population on Food Stamps or SNAP (Last 12 Months), by Zip Code (ZCTA5) — Boston Metro
- % of Population on Food Stamps or SNAP (Last 12 Months), by Zip Code (ZCTA5) — Detroit Metro
- % of Population on Food Stamps or SNAP (Last 12 Months), by Zip Code (ZCTA5) — Dallas Metro
- % of Population on Food Stamps or SNAP (Last 12 Months), by Zip Code (ZCTA5) — Orlando Metro
- % of Population on Food Stamps or SNAP (Last 12 Months), by Zip Code (ZCTA5) — Houston Metro
- % of Population on Food Stamps or SNAP (Last 12 Months), by Zip Code (ZCTA5) — Phoenix Metro
- % of Population on Food Stamps or SNAP (Last 12 Months), by Zip Code (ZCTA5) — Chicago Metro
- % of Population on Food Stamps or SNAP (Last 12 Months), by Zip Code (ZCTA5) — Seattle Metro